Showing posts with label ETF. Show all posts

Friday, January 30, 2015

Valuing ETFs the Benjamin Graham Way

This article appeared on the blog Investrepreneurship on Oct 14, 2010


Individual investors might be able to properly analyze a stock or even a few stocks. But while an exchange traded fund (one based on an equity index) is essentially just a basket of stocks, it might not be feasible for an individual investor to analyze an ETF as extensively as he or she would a stock, as the investor would need to value every single stock that the ETF represents. Fortunately, some valuation methods and principles that apply to stocks can also be applied efficiently to an ETF.

In this article, I will be talking about two Benjamin Graham’s investing principles that I use to help me value ETFs: Avoiding stocks (or in our case, ETFs) that have a Price/Earnings ratio that’s higher than the earnings yield of the stock + the stock’s growth rate (found this golden nugget at www.Joshua Kennon.com), look for stocks with price to book below 1.5, and investing with a margin of safety.    

Look for ETFs with P/E below its earnings yield + growth rate

Say, an ETF you want to value has a P/E ratio of 15 (Each ETF provider might have its own way of calculating P/E, but we will get to that a little later). We start our analysis by finding the earnings yield of the ETF. You can get the earnings yield by dividing earnings by the price or dividing 1 by the P/E ratio. For our example, 1/15 = 6.6% earnings yield. The earnings yield is the profits that the company earned in the most recent 12-month period, expressed as a percentage of its market cap or share price, depending on how you look at it.

Let’s also say that the provider of the ETF estimates that the fund will grow earnings at 15% over the next 3-5 years. The 15% growth rate + the 6.6% earnings yield would equal to 21.6. The ETF has a P/E ratio of 15, so it passes the test of having a P/E ratio below its earnings yield + growth rate. We still need to look at the other 2 principles before we make any kind of decision, though.

Identify ETFs with price to book below 1.5

Benjamin Graham said that, for defensive investors, the price to book should generally not be above 1.5, but exceptions can be made if the P/E ratio is below 15. As a rule of thumb, he said that the P/E ratio times the price to book ratio shouldn’t be higher than 22.5. For simplicity’s sake, our example ETF will have a price to book of 1.5. So, 1.5 times 15 will equal to 22.5. This principle is meant for defensive investors, but if you don’t mind taking a little bit more risk, and you know how to properly research an ETF, then it can be ok for you to buy that ETF at a higher valuation.

Margin of safety

The margin of safety principle states that investors should only invest in a stock if the stock’s price is significantly below its intrinsic value, so as to reduce the risk of losses. By applying the first principle to our example ETF, we’ve found that the ETF’s rough intrinsic value can be said to be around a P/E of 21.6 (earnings yield 6.6% + 15% growth rate). And the current price of the ETF is a P/E of 15 (of course in real life the ETF will have a share price, but we will just use the P/E ratio as a proxy for price here). So, there is a margin of safety in our example, whether the margin of safety is significant enough is, of course, up to the individual investor.

With valuation methods (at least the ones that I talked about in this article) only giving us a very rough estimate of intrinsic value, forecasted growth rates that might not materialize or cover a long enough period, and as I mentioned earlier, different ETF providers potentially calculating the P/E ratio differently, which can result in inaccurate P/E ratios, investing with a margin of safety becomes especially important in the case of ETFs.


If you have any questions, or have anything that you would like to share, please don’t hesitate to comment. Thank you for reading, and may you always sustain good returns on your portfolio. Take care.

(Captain obvious side note: While I believe that the Benjamin Graham’s principles I talked about in this article can help us tremendously in valuing ETFs, investors also need to take into account other things like fees and etc.)   

Thursday, January 29, 2015

Cash In On The Currency Wars Using ETF's ?


Summary


  • Currency ETF's are becoming volatile as'Currency Wars' expand.

  • The US Dollar strength is impairingsales and profits for manufacturers.

  • European politics is creating turmoilfor the Euro and that will impact many currencies.

  • We have tools and alternative tools toexploit fluctuations in currency ETF's.


Let's have a look at this chart I haveconstructed using Relative Strength factor of a US Dollar IndexETF(UUP) and six ETF's which are used to make up the US Dollar Index.

The six US Dollar Index component ETF'sI have selected are Guggenheim FXF,FXB,FXC, FXC, FXY, FXSrepresenting Swiss Franc, British Pound, Canadian Dollar, JapaneseYen, Euro, Swedish Krona.


You may ask, 'What good is thiscomparison chart?'


At some point the distances betweenthese plots will start to narrow based on the actions of the variousgovernments and markets and whatever manipulations may occur in orderfor different currencies to gain or lose advantages.

We need only look at what has occurredin the past couple of weeks with the Swiss Franc, the Canadian Dollarand the Euro.

This next chart reflects the RelativeStrength factor of the seven Etf''s that I am using, you can see thatFXF, Swiss Franc, is outperforming the other component currency ETF'sand that is based on the sharp move generated by Swiss governmentintervention a few days ago.


How can we use this chart?

Interestingly enough, each governmentinvolved as well as the EU is attempting to capture markets and theyare going to do their best to manipulate their own currency and anyother currency to their advantage. Volatility in currencies as wellas stocks is being created daily with the manipulations.

I gathered some information from Pointand Figure charts at Stockcharts.com and am going to list the targetprices for each of these currency ETF's. The numbers may surpriseyou.

FXF 151.00
FXB 210,00
FXC 84.00
FXY 62.00
FXE 86.00
FXS 82.00
USDX 128.00 (P&F target for UUPunavailable)

From those targets you can see hugedifferences from prices today, there will certainly be some activityas months pass. P&F targets are not guaranteed, I used them onlyas an illustration.

What can we use to take advantage ofthese pending moves. There are many choices , however UUP and UUD maybe quite suitable for most people as those represent long and shortrespectively. Some may favor using the PowerShares 3x Long UUPt orthe PowerShares 3x Short UDNT.

I have compared the four of these asfollows.


Using Relative Strength factor forcomparison is most useful for trade selection and also trademanagement and may add another dimension to your trading system.

Tuesday, January 27, 2015

9 Currency ETF's That May Influence Your Trading Strategy


Many Forex Traders and Investors have asizable interest in what may be happening to various currenciesregarding their trading strategy. Today I will gather someinformation on a group of ETF's related to several of the heavilytraded currencies.

  • Currencies are volatile today and will be more volatile as weeks pass.
  • Countries are manipulating their currencies to gain advantages and export markets.
  • Politicians are exploiting interest rates and QE programs to stimulate their economies


The following are the Guggenheim'CurrencyShares' Trust Vehicles:

Australian Dollar (FXA)
Canadian Dollar (FXC)
Euro (FXE)
Japanese Yen (FXY)
British Pound (FXB)
Swedish Krona (FXS)
Swiss Franc (FXF)
Singapore Dollar (FXSG)
Chinese Renminbi (FXCH)


As you can see, this list covers theimportant and most heavily traded currencies exclusive of the USDollar.

In another article I will explore therelationships of each of these currencies with the US Dollar.

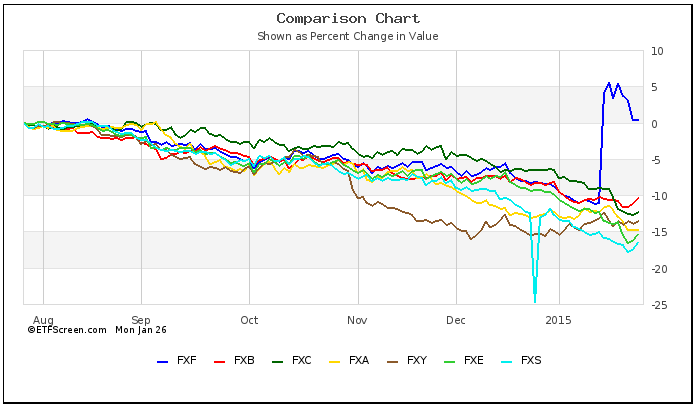
Here is a chart from ETFScreen.comoutlining a comparison of the Relative Strength factor for the pastquarter. Of course, as each day passes there will be changes inRelative Strength factor and the order in the list will change.


This next chart illustrates acomparison in percent change for the past several months, I amassuming that the down slope is closely related to the climb in theUS Dollar.


This chart, from etf.com illustratesthe fund flows into each of these ETF's for the past month.


Of course we want to know what is inthe future for currencies and that is not easy to know, there havenot been many successful forecasters. However, there is one school ofthought that we can consult and that is based on past performance.

Point and Figure Charts are not theholy grail, however they have a good track record and for thispurpose they will cast some light on future direction.

Here is the P&F chart for FXA, theAustralian Dollar Trust, I point out the Bearish Price Objective.


Instead of posting a P&F Chart inhere, I will list the Price Objective (as at January 23,2015) foreach Currency ETF.(Source Stockcharts.com)

Australian Dollar (FXA) 70.00
Canadian Dollar (FXC) 84.00
Euro (FXE) 86.00
Japanese Yen (FXY) 62.00
British Pound (FXB) 210.00
Swedish Krona (FXS 82.00
Swiss Franc (FXF) 151.00
Singapore Dollar (FXSG) -
Chinese Renminbi (FXCH) -

(FXSG and FXCH unavailable)


I will be updating the information on each of these currencies and ETF's in coming days.


Thursday, January 22, 2015

Top Performing Currency ETF Using Relative Strength Factor Trading Strategy as at January22, 2015

The Top 5 Currency ETF's today using the Relative Strength Factor Trading Strategy are shown in this chart. (ETFScreen.com)


We can take a look at this group and make some comparisons regarding performance.


The best performer in this group is the 

PowerShares DB 3x Long US Dollar Index Futures ETN


Some statistics:


Here is a one year chart:


Here is a Point and Figure Chart showing a target price of $83.50.


Friday, January 16, 2015

ETF Trading Strategy as at January 15, 2015

The good people at ETFScreen.com have a unique system of ranking the performance of their list of ETF's. They have developed a Relative Strength Factor rating system which is updated often during the trading day.

Here is the definition of the RSf.

'Relative Strength Factor(RSf) is a percentile ranking of the fund's performance relative to other funds and relative the broad U.S. market performance. It is measured over 1 year and weighted to emphasize more recent performance. The values for RSf range from 0 thru 99.99 with the better performing funds having higher values.'

I am going to place in here the top 5 ranked items and then have a more detailed look at the top performer.


Lets have a look at the top listed one  DNO, using the chart on the site.


Some  Performance detail


As you can see this instrument has been moving higher for a while, it will be interesting to look at a Point and Figure chart to see what the price target may be.


For further detail on this fund you can look at this web page

Tuesday, November 25, 2014

The Relative Strength Factor

The Relative Strength Factor is a vital member of the trading strategy toolbox for many longer term investors.

It is used to measure performance of one instrument against a group of instruments and from that measurement an investor can quickly determine if he will do further work or look for another instrument to invest in.

ETF investors use this measure constantly as they are evaluating. Several sites on the internet have screeners available for their version of the Relative Strength Factor.

There is more than one way to develop a Relative Strength Factor, eg you can use the current stock price move against the related index value, or compare percentage change in the price versus percentage change of the index price.

There are a few places on the internet that offer screens related to the Relative Strength Factor'

  • Investors Business Daily for Stocks
  • ETFSCREEN for Etfs
  • Microsoft
  • ETFdb
  • TMXMoney
  • Morningstar


Here is an article regarding screening Wall Street Journal including a number of resources.

ETF Information Overload!


According to Dorsey Wright

'Relative strength strategies have a long history of delivering market-beating returns.'

ETF Chart of the Day, November 25, 2014

This ETF, Direxion Daily Healthcare Bull 3X ETF is showing considerable strength of late and probably deserves a close look.

Some information from the management of the fund, Direxion Investments:


Fund Symbol CURE
Daily Target 300%
Intra-day Indicative Value CURE.IV
Bloomberg Index Symbol IXV
CUSIP 25459Y876
ISIN US25459Y8764
Gross Expense Ratio 1.21%
Net Expense Ratio 0.95%*
Inception Date Jun 15, 2011

Overview

The Daily Healthcare Bull 3x Shares seeks daily investment results, before fees and expenses, of 300% of the performance of the S&P Health Care Select Sector Index. There is no guarantee the fund will meet its stated investment objective.
This leveraged ETF seeks a return that is 300% the return of its benchmark index for a single day. The fund should not be expected to provide three times the return of the benchmark’s cumulative return for periods greater than a day.


Performance
NAVs and market price information as of November 24, 2014


All data as of 10/31/2014
Ticker Fund Name 1 Mo % 3 Mo % YTD % 1 YR % 3 YR % 5 YR % 10 YR % Since Inception Inception Date Expense Ratio* (Gross/Net %)
CURE Daily Healthcare Bull 3x Shares NAV 14.81 32.62 71.99 100.25 96.12 71.22 1.21 / 0.95*
Market Close 14.92 32.69 71.80 99.16 94.06 71.21


From WallStreet Scope Nov 7

Direxion Daily Healthcare Bull 3X ETF (CURE) of the Financial sector (Exchange Traded Fund) lost -2.75%, a change from open of -3.5700% ($-3.23 per share) at the close of the normal trading day Friday with a volume of 95712 shares.  Direxion Daily Healthcare Bull 3X ETF (CURE) ended the day at $117.43 with a market cap of ,  insider ownership of , volume of  095,712 and a weekly performance of 2.84%. Direxion Daily Healthcare Bull 3X ETF (CURE)’S monthly performance stands at 13.27% and Direxion Daily Healthcare Bull 3X ETF (CURE) is considered a stock to watch for the upcoming trading day.

Here is a chart made after the close on Tuesday Nov 25, you can see that this stock has had a long advance and is still very strong.

In fact, the Relative Strength Factor for this ETF is 99.6


I want to draw your attention to the Point and Figure chart for this instrument, you will see a Bullish Price Objective of $215.00


This ETF is certainly deserving of a place in your watchlist and may well become a part of your trading strategy.


Good Trading..!

Some additional information on the Relative Strength Factor