Any USDCAD Trading Strategy will have to be tempered with the view that this pair is going lower in, at least, the short term.
There have been some fluctuations in price in this pair as the two economies are facing different hurdles.
I have a chart here showing some divergence that probably indicates that the Canadian dollar will be settling lower in days to come.

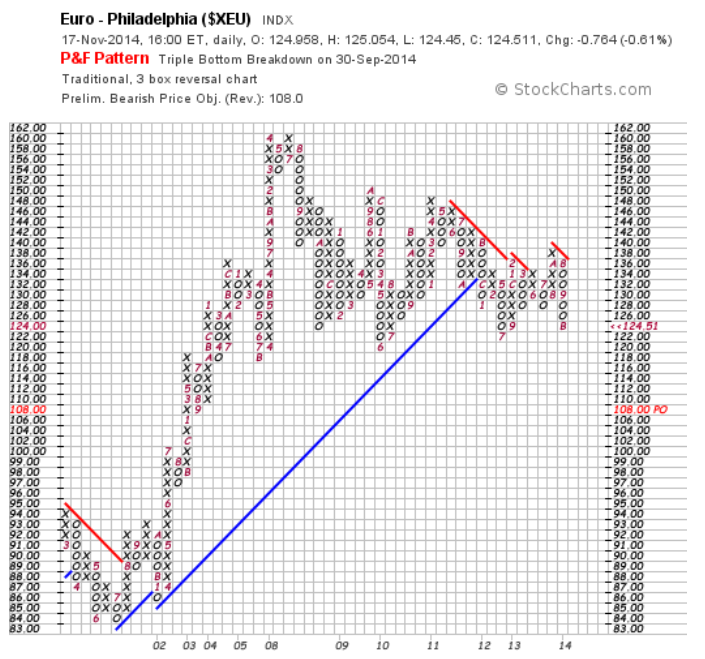
I have another chart, a Point and Figure chart of the Canadian Dollar which shows a target of .86, also indicating a further drop.

In fundamental news affecting the Canadian Dollar:
- International Securities Transactions lower than expected.
- Oil Prices softening
- Gold prices easing back into a consolidation
On Friday will be released the Canadian Consumer Price Index(CPI) which may influence the Canadian Dollar in a positive way.
My expectation is that the US Dollar will resume its rise against the Canadian Dollar in the short term.