Showing posts with label Divergence. Show all posts

Monday, August 17, 2015

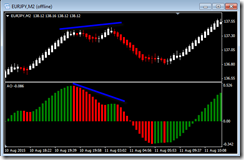
Awesome Oscillator Renko Divergence Trade from August 17, 2015


Using Divergence as a trading strategy can be rewarding and using the awesome oscillator with Renko bars can be quite simple.

Here is an example from today’s trading on the EURUSD currency pair.

AweSome Oscillator Divergence Renko August 17, 2015


You can see that this entry provided a nice profit, above all, it was easy to see the divergence pattern. A person could be working with several charts at the same time and observing divergences.

In another post from yesterday I pointed out a divergence on the same pair. While the divergence did give trade, it was not the greatest profit. Some of them are good and some are not so good, as with any trading strategy.
Here is the chart I am referring to, probably the best entry was to wait for a couple bars to be above the 0 line on the oscillator to ensure that there was a good move.
AweSome Oscillator Divergence Renko August 17, 2015 1


Divergence trades are plentiful, and the tools that can be used are several.

Here are a few examples of divergence:

http://boutiquetradingstrategies.blogspot.ca/2014/11/what-is-best-for-determining-divergence.html
http://boutiquetradingstrategies.blogspot.ca/2014/11/can-we-use-twiggs-money-flow-for.html
http://boutiquetradingstrategies.blogspot.ca/2014/11/exelon-is-showing-bearish-divergence.html
http://boutiquetradingstrategies.blogspot.ca/2014/11/divergent-opportunities-for-november-4.html
As I mentioned previously, divergence is not a fool proof method for a trading strategy, it is merely a tool and must be confirmed by price action

Good Trading..!

Sunday, August 16, 2015

Renko Awesome Oscillator Divergence Trading Strategy


A trader usually wants to know when the end of a trend is about appear so that he can adjust his trading strategy to take advantage of the next trend.

Of course, divergence between price and oscillator is one way to be prepared.

One of the indicators that will point out divergence is the Awesome Oscillator which is found in most charting packages.

Using Renko bars together with an oscillator is a great way to eliminate the chop and see clearly when there is a divergence appearing.

I have attached three charts on which I have marked divergences, just to give an idea as to how simple it is to spot them.

Divergences are not to be traded blindly as the market does not always change trend with a divergence. Therefore we have to observe price action before making any entry.

Screen time and practice is required to hone the skills in trading and divergence is not a shortcut to any success, the hours have to be put in to learning how to use divergence, the same as any other tool.


Awesome Oscillator Divergence Renko_Trading_Strategy 1


Awesome Oscillator Divergence Renkp_Trading_Strategy


Awesome Oscillator Divergence Renko_Trading_Strategy 2


Enjoy!

Saturday, August 15, 2015

US Dollar Index Trading Strategy As At August 15, 2015


The US Dollar Index will certainly affect the trading strategies of the several currency pairs that make up this basket.

There is much discussion in the United States and elsewhere as to when interest rates may start to move higher and that will certainly affect all of the currencies.

Lets have a look at several charts and see what clues we can discover as to what may be a future direction.

This first chart has the Macd and a quick glance shows a bearish divergence. You will see that there is quite an amount of Bearish influence showing as you glance at these charts.


This next chart, a daily chart shows a bearish Fibonacci Pattern which seems to confirm the bearish divergence on the Macd.


Now we have the Ichimoku Kinko Hyo chart showing that price is above the cloud. It may be that the cloud is going to provide support and prevent much of a movement south, perhaps a few ranging days are ahead.


Another Bearish Fibonacci Pattern on the monthly chart.


We can see on this chart that price is below the pivot and has been fluctuating above support, directionless, so far.


Price has moved below the weekly pivot and also below the monthly pivot.


Here is more discussion by several authors. You will see a variance in expectations as to direction.

US Dollar Index Forecast August 17, 2015, Technical Analysis - FX Empire
http://news.google.com Sat, 15 Aug 2015 04:53:00 GMT
FX EmpireUS Dollar Index Forecast August 17, 2015, Technical AnalysisFX EmpireThe US Dollar Index went back and forth during the course of the session on Friday, bouncing off the 96 level for support. With that being the case, the market looks as if ...
Read more ...
US Dollar Index (DX) Futures Technical Analysis – August 14, 2015 Forecast - FX Empire
http://news.google.com Fri, 14 Aug 2015 11:22:28 GMT
FX EmpireUS Dollar Index (DX) Futures Technical Analysis – August 14, 2015 ForecastFX EmpireSeptember U.S. Dollar Index futures are trading slightly lower shortly before the cash market opening. For the second consecutive day, the market is trading i ...
Read more ...
Dollar Slips This Week on Blurred Picture for US Rates - Wall Street Journal
http://news.google.com Fri, 14 Aug 2015 20:18:39 GMT
USA TODAYDollar Slips This Week on Blurred Picture for US RatesWall Street JournalThe dollar edged broadly lower this week as uncertainty over China and depressed global inflation pressures clouded investors' view on U.S. interest rates and limited t ...
Read more ...
The Week Ahead: How Important Is China or The Dollar To Your Portfolio? - Forbes
http://news.google.com Sat, 15 Aug 2015 12:49:44 GMT
ForbesThe Week Ahead: How Important Is China or The Dollar To Your Portfolio?ForbesI began analyzing the financial markets in 1982 when I became the research director for a financial advisory firm and provided regular market analysis on stocks, commo ...
Read more ...
China hoarding gold in move to challenge dollar - WND.com
http://news.google.com Sat, 15 Aug 2015 01:25:38 GMT
WND.comChina hoarding gold in move to challenge dollarWND.comBorneman noted the IMF is scheduled to meet in October, and on the agenda is whether to allow China's currency into the SDR pool, a basket of currencies that includes the U.S. dollar, the e ...
Read more ...
Pound to Dollar Rate Forecast to Decline from Here - Pound Sterling Live
http://news.google.com Sat, 15 Aug 2015 10:58:00 GMT
Exchange Rates UKPound to Dollar Rate Forecast to Decline from HerePound Sterling Live“Sterling outperformance though largely stemmed from euro strength against the dollar. Underlying sentiment for the pound suffered in data this week that showed the ...
Read more ...
Dollar Looks for Fed Move as Major Counterparts Gain Ground - DailyFX
http://news.google.com Sat, 15 Aug 2015 03:34:00 GMT
DailyFXDollar Looks for Fed Move as Major Counterparts Gain GroundDailyFXThe 'Summer Lull' doesn't do the US Dollar any favors. As a favored haven currency, the reduced volatility - and thereby risk - curbs its innate demand. Further, as market depth ...
Read more ...


Monday, August 3, 2015

Renko Trading Strategies (3)

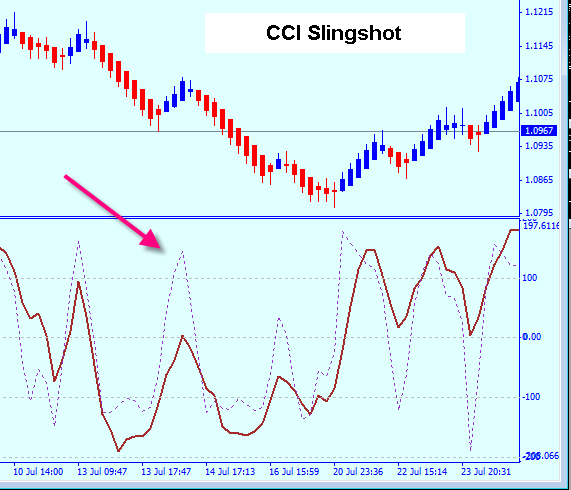
I want to demonstrate the CCI Slingshot as a Renko Trading Strategy that can be employed on a daily basis on most charts.

This one will require two indicators to make it work. First we will place a CCI14 on the chart and then overlay that with a CCI6 (the dotted line)

Note that in this example the CCI 14 has approached the 0 line before easing back while the CCI6 has approached the 100 level. It has to be this way, if the CCI6 does not get high enough the trade could be  a bad entry causing a loss.

This pattern is actually a divergence between the two indicators.

See the example here


You can see that the CCI Slingshot is actually a continuation move on the trend.

This entry can be used to initiate a trade or to add to a position.

Again, all that is needed for this is two CCI indicators overlaied in a lower chart.

This example is a short pattern


Notice there is a similar pattern to the left of the one with the arrow. This one does not qualify as a CCI Slingshot because the CCI14 rose far above the zero line. That is an important aspect, the CCI14 has to rise to close to the zero line......

This Renko chart has 20 pip bars, you can see that the slingshot entries can be quite lucrative.

Of course it takes practice to see these patterns on the indicator, all entries must be 'With trend'.

If you have been looking at the posts about the Renko charts on this blog you are seeing how simple it can be to trade with Renko Bars.


There are several other Renko Trading Strategies on this blog, hopefully you will have a chance to examine those.

Saturday, November 15, 2014

Forex Scan Results by the Rambunctious Pig As At 12:30 am November 16, 2014

Thesescans will perhaps add to your trading strategies. Eventually therewill be several moving average crossovers and Macd crossovers,initially for Forex and then adding some stocks and indicies.


These results reflect crossovers on the Daily Chart and the 4 hourchart only.

Divergenceshave been added lower on the page.

Therewill be more results of other scans as time permits on a regularbasis.

Hereis the result of Moving Average Crossover Scan Completed in the last15 minutes. Using SMA 5 crossing SMA 10.

RecentMoving Average Crosses SMA 5 crossing SMA10

DailyChart Bearish Cross

DailyChart Bullish Cross SILVER AUDCAD

240MINUTE CHART Bearish EURCAD USDCAD

240MINUTE CHART Bullish SILVER CADCHF EURUSD


MACDCROSSOVERS FOREX

Macd 12, 26, 9 crossed BELOWits signal line within past 5 trading days: FOREX

GBPAUD
GBPCAD
GBPNZD
GBPCHF
CADNZD
CHFAUD
USDAUD
USDCAD


Macd 12, 26, 9 crossed ABOVEits signal line within past 5 trading days: FOREX

AUDCAD
AUDCHF
AUDUSD
CADUSD
EURGBP
NZDGBP
NZDCAD
NZDUSD

NEW HIGHS IN THEPAST WEEK

AUDJPY
GBPJPY
CADJPY
EURJPY
NZDJPY
CHFJPY
USDAUD
USDGBP
USDJPY


NEW LOWS IN THE PASTWEEK


GBPUSD
EURCHF


BULLISH DIVERGENCES

NONE


BEARISH DIVERGENCES

GBPJPY

These scan results are as at the end of the trading day November 14. Of course the markets could open much differently that they closed for the weekend, these scans may be of no value for the open.

Have a great week ahead.!!


Thursday, November 13, 2014

Forex Scan Results by the Rambunctious Pig as at 12:15 Am EST November 13, 2014

Thesescans will perhaps add to your trading strategies. Eventually therewill be several moving average crossovers and Macd crossovers,initially for Forex and then adding some stocks and indicies.


These results reflect crossovers on the Daily Chart and the 4 hourchart only.

Divergenceshave been added lower on the page.

Therewill be more results of other scans as time permits on a regularbasis.

Hereis the result of Moving Average Crossover Scan Completed in the last15 minutes. Using SMA 5 crossing SMA 10.

RecentMoving Average Crosses SMA 5 crossing SMA10

DailyChart Bearish Cross GBPAUD EURAUD USDCAD GBPCAD

DailyChart Bullish Cross GOLD AUDCHF NZDUSD AUDUSD CADCHFGBPCHF

240MINUTE CHART Bearish GOLD CADJPY GBPUSD

240MINUTE CHART Bullish 


MACDCROSSOVERS FOREX

Macd 12, 26, 9 crossed BELOWits signal line within past 5 trading days: FOREX

AUDCAD
AUDNZD
GBPAUD
GBPCAD
GBPNZD
CHFAUD
CHFCAD
GBPUSD
CADNZD


Macd 12, 26, 9 crossed ABOVEits signal line within past 5 trading days: FOREX

AUDCHF
NZDAUD
NZDGBP
NZDCAD
NZDUSD
USDGBP

NEW HIGHS IN THEPAST WEEK

AUDJPY
GBPJPY
CADJPY
EURJPY
NZDJPY
CHFJPY
USDAUD
USDGBP
USDDKK
USDJPY
USDCHF


NEW LOWS IN THE PASTWEEK

AUDUSD
GBPUSD
EURCHF
EURUSD
NZDUSD


BULLISH DIVERGENCES

GBPUSD
CADUSD
EURCHF
EURUSD


BEARISH DIVERGENCES

USDGBP
USDCAD
USDDKK


Some Charts follow to illustrate the Divergences. Although there is a divergence, a trend change at this time can not be relied upon, divergence is just an indication of a potential trend change.

Enjoy your day  !!


Friday, November 7, 2014

Can We use CCI Divergences to Enhance Our Trading Strategies?

What is the CCI and how will it assist a trading strategy?


Simply put, the Commodity Channel Indicator was created in about 1980 by Mr Donald Lambert and it is used by traders to  determine extremes in price and potential reversals.

Most of the time it does an amazing job in illustrating divergences between price and oscillator.

Many traders use the CCI patterns for their entries and exits, however that is not the main purpose of this article. Perhaps another day we can look at how people can make use of the indicator and its levels for entries and exits.


Does Divergence always lead to a profitable entry?  NO!


Divergences are a hint that something may be coming in the way of a change in direction but they are not to be relied upon. Price action tells the truth. So many times a trader can be fooled by the indicators he has on his chart. The indicators are not perfect, the market has a way of proving this to us constantly.


What Does Divergence Look Like?


For your review I am inserting a diagram from the www.trading-naked.com site, this is an excellent explanation for someone new to using divergence


This diagram has been used by many, many people and it simplifies things greatly.

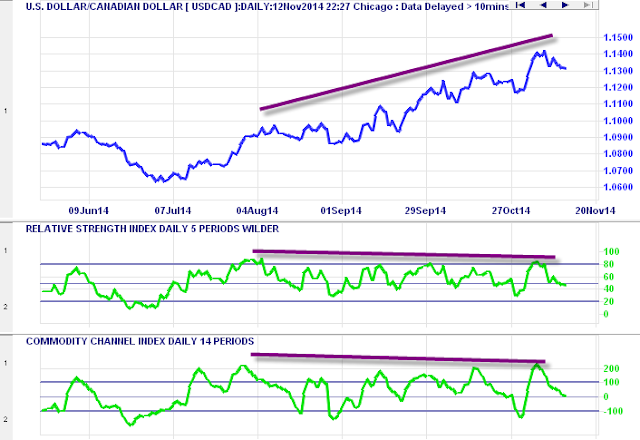
The application of detecting divergences can be as simple as drawing lines on both the oscillator and the price chart, draw from tops to tops on both or from bottoms to bottoms on both. And then compare the lines as per the diagram above. It will not take very long for you to see how valuable the CCI can be for your trading strategy.

To learn how to apply this method, a person has to spend some time actually drawing lines on charts and it may be something that has to be practiced for a few weeks until it finally clicks.. The good news is... once you have established some competence in detecting divergences you will spot them quickly and easily even before you draw the lines.

What are the takeaway's from all this?


  • The CCI is an excellent tool for spotting divergences.
  • The CCI is available on most charting programs.
  • Divergences can point the way to pending trend changes.
  • By adjusting the period of the CCI indicator you can make it more or less sensitive to divergences.

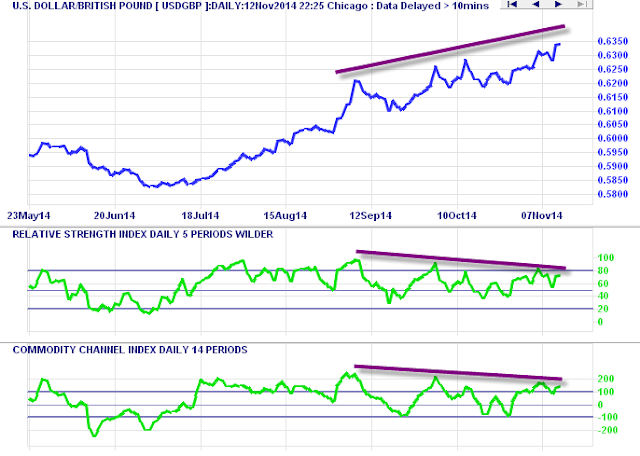
Let's have a look at what might be happening next week. I have marked some divergences on a couple charts and you may see from these and some that you may mark on your own that there appears to be a change coming in the Forex pairs.


Once you have worked with this for a few hours you may well decide to add this to your trading strategies.

Enjoy your weekend!!

Update:

Here are two excellent examples of divergences that worked well to forecast a trend change. This morning was the Non Farm Payroll announcement which caused a change in the markets. On these charts I had the Macd set up and sure enough, what was indicated by the divergence actually occurred. Take a look at the charts.


US Dollar Index


Gold


Tuesday, November 4, 2014

What Is Best For Determining Divergence?

How best to spot the divergences so as to improve your trading strategy?


Because I quite like using divergence as a signal for trading I am often looking at various oscillators to see which one is best.

That is a tough question to answer as oscillators are all constructed with a different method.

And each oscillator will react to a situation a little differently, sometimes showing the divergence and sometimes not detecting it.

What indicators will show divergences?


Here are a few that I have used:

  • Stochastic Oscillator
  • Moving Average Convergence Divergence
  • Commodity Channel Indicator
  • Twiggs Money Supply
  • Rate of Change Indicator
  • Momentum


Each of these has its own quirks and we can only depend on them after having used them for a long time so as to learn about their individual habits

What do I use?


I do scans for divergence daily and throughout the day and I scan different time frames as there are many opportunities especially in times of volatility.

My favorite chart is one with each of Macd, CCI and TMF, the reason for the three is that each detects divergences differently.

Here is the chart I am using at this time and I may well change it as time passes and I find it to be less productive. You will see on it that I have the three indicators.


Check out each of those indicators and you will see that all three are different and the warning of approaching trend change is delayed by a couple of them.


Can We Use Twiggs Money Flow for a Divergence Strategy?

Will Twiggs Money Flow Show Divergences?

This indicator is created by the folks at Incredible Charts and is derived from the Chaikin Money Flow but fixes some of the CMF's weaknesses. The main difference is the exponential smoothing of the Accumulation Distribution values from which the Money Flow is derived. More info can be found at Incredible Charts.


Price and volume are very important to determine the  health of the market. The TMF uses averages to account for gaps and yesterday's market as well as today's.


One great feature about this indicator is that it illustrates divergences well and it can be adapted to long or short periods.
Its signals are simple and easy to read making it perfect for scanning for divergences.

Difference Between Macd and Twiggs Money Flow


Here is a chart for Fedex with the Macd and the Twiggs Money Flow indicators. You will see that there is a divergence showing on the TMF but not much on the Macd. The reason being that the TMF is accounting for volume as well as price, thus being, perhaps, a much more definitive indicator for this purpose.


I have collected some articles to outline some applications of the Twiggs Money Flow. You wiull see that the first two were written by Mr Colin Twiggs, who better than he to explain how the indicator can be used with real time examples.


Asia: Governor Kuroda bets on QE | Gold, Stocks & Forex
Tue, 04 Nov 2014 00:05:25 -0800
The Nikkei 225 surged through 16300, signaling a fresh advance. The long-term target is 18000*. Reversal below 16000 is unlikely, but would warn of another correction. Recovery of 13-week Twiggs Money Flow above zero ...
Read more ...


October correction nearing end | Gold, Stocks & Forex
 Sat, 25 Oct 2014 01:45:53 -0700
Penetration of the descending trendline suggests that the October correction is over. Recovery of 21-Day Twiggs Money Flow above zero indicates medium-term buying pressure. Expect a test of resistance at 2000 followed by ...
Read more ...


And this last article is an explanation about the indicator written by a blogger


Welcome to My Domain: Twiggs Money Flow
 Sun, 20 Feb 2011 18:14:00 -0800
Twiggs Money Flow is a derivation of Chaikin Money Flow indicator, which is in turn derived from the Accumulation Distribution line. However, Twiggs Money Flow makes two basic improvements to the Chaikin Money Flow ...
Read more ...


This is a direct link to Incredible Charts where there is a complete explanation of the Twiggs Money Flow Indicator.

Exelon Is Showing Bearish Divergence


Update: I have posted an update to this post as at November 17, 2014.


Exelon has had a lengthy rise and has done well for its investors. There may be a stall coming in the advance as the Twiggs Money Flow is showing some bearish divergence.


I am adding this chart to the mix as divergences are often made obvious by Macd or CCI and the Twiggs indicator can also be illustrative.


Here is the chart showing the divergence. (click on the chart to enlarge)


Exelon is a huge corporation with some diverse interests, I have curated a couple articles and as you will see in the articles not all writers are in favor of current policies.

First a look at part of the Bloomberg Snapshot for Exelon:


You can see the rest of the Bloomberg Snapshot here.


This 'market solution' only benefits Exelon - Crain's Chicago Business
 Sat, 01 Nov 2014 20:11:04 GMT
This 'market solution' only benefits ExelonCrain's Chicago BusinessYou know you've got a good thing going when profitability is only a bailout away. That's the kind of mojo that's working at Exelon Corp., which is signaling it will seek legislation n ...
Read more ...


$580 MILLION EXELON RATE HIKE?? That's the price tag for their nuke bailout ... - The Capitol Fax Blog (blog)
Sat, 25 Oct 2014 15:11:15 GMT
$580 MILLION EXELON RATE HIKE?? That's the price tag for their nuke bailout ...The Capitol Fax Blog (blog)Yet now Exelon is demanding an annual 580 million dollar bailout from ratepayers—industrial, commercial and residential—because they don't want ...
Read more ...


Exelon Earns 'Buy' Rating from Deutsche Bank (EXC) - Ticker Report
 Mon, 03 Nov 2014 18:07:43 GMT
Exelon Earns 'Buy' Rating from Deutsche Bank (EXC)Ticker ReportExelon Co. logo Deutsche Bank reiterated their buy rating on shares of Exelon (NYSE:EXC) in a research report released on Thursday morning. Deutsche Bank currently has a $36.00 price obje ...
Read more ...


Exelon Reaches Deal with ArcLight to Sell Pennsylvania Power Plants - TheStreet.com
 Thu, 30 Oct 2014 16:08:59 GMT
Exelon Reaches Deal with ArcLight to Sell Pennsylvania Power PlantsTheStreet.comExelon, the Chicago-based electric, is progressing smoothly with its noncore power plant divestitures. Just this week, Exelon and its sellside adviser Bank of America Mer ...
Read more ...