How best to spot the divergences so as to improve your trading strategy?
Because I quite like using divergence as a signal for trading I am often looking at various oscillators to see which one is best.
That is a tough question to answer as oscillators are all constructed with a different method.
And each oscillator will react to a situation a little differently, sometimes showing the divergence and sometimes not detecting it.
What indicators will show divergences?
Here are a few that I have used:
- Stochastic Oscillator
- Moving Average Convergence Divergence
- Commodity Channel Indicator
- Twiggs Money Supply
- Rate of Change Indicator
- Momentum
What do I use?
I do scans for divergence daily and throughout the day and I scan different time frames as there are many opportunities especially in times of volatility.
My favorite chart is one with each of Macd, CCI and TMF, the reason for the three is that each detects divergences differently.
Here is the chart I am using at this time and I may well change it as time passes and I find it to be less productive. You will see on it that I have the three indicators.
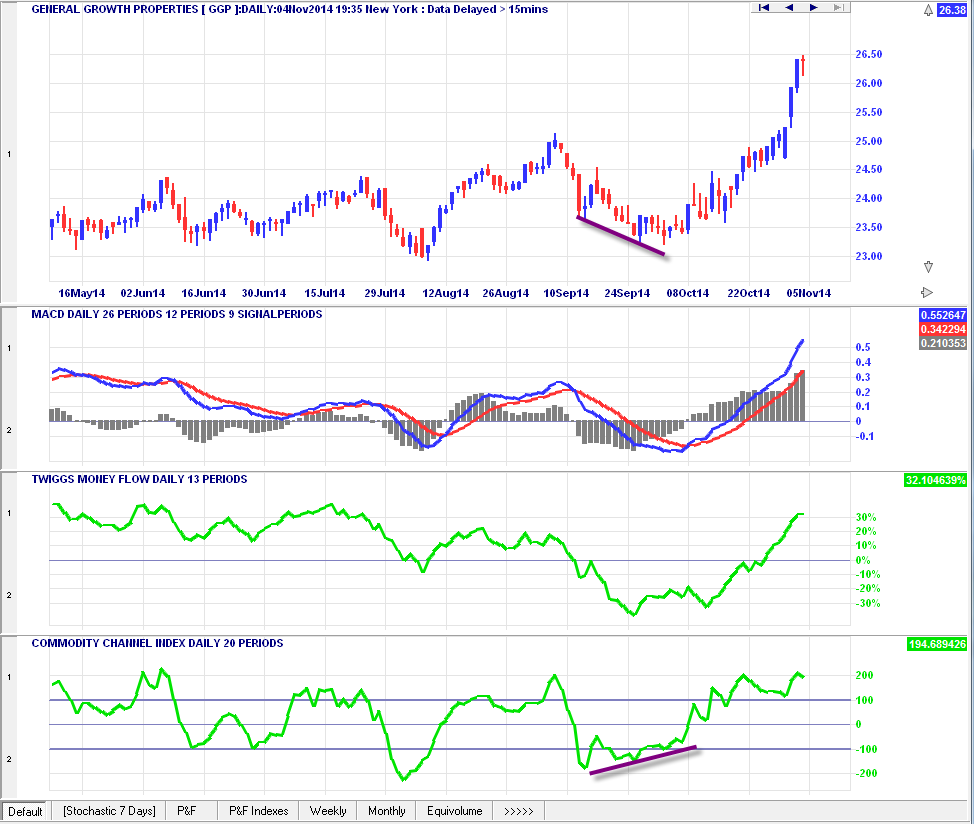
Check out each of those indicators and you will see that all three are different and the warning of approaching trend change is delayed by a couple of them.
No comments:
Post a Comment