Wednesday, November 30, 2016

3 Excellent Forex News Sites


There are many sites  that provide excellent news and news summaries. I have selected these three for today as they each offer something unique and also very valuable to a trader.

A trader has only so many hours in a day and needs access to news quickly for decision making purposes. These sites are  quite different from each other and present very useful aspects.


These news sites I peruse often when looking for updates as to what might be happening with different currencies.

Some of these sites offer perspectives based on the economies of the countries involved and some of them are focused on news announcements.

They are listed in no particular order as each has its own merits and would be hard to be rating them as best or second best . These are all excellent.

ForexFactory


ForexFactory has a comprehensive news site featuring very current articles from many sources around the web.

Excellent about ForexFactory news is that you can select different views so as to be able to focus on certain areas.


 .
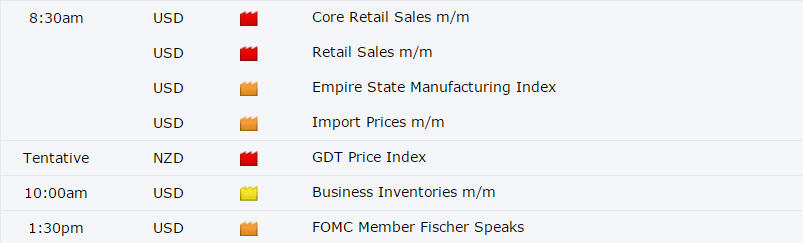
Each news item can be assigned an ‘Impact’ rating to easily indicate which news has potential to affect the market and there is the facility to drill down with each item to see the forecast expectations.


The ForexFactory site is simply huge. The forum has thousands of threads and there are many, many posts per minute. This is a favorite for many traders.


MyFxBook


This site has some unique features for news. The Economic Calendar shows the upcoming news announcements with their impact and what is great about this page is that it gives the time remaining and then a notification as the time approaches.


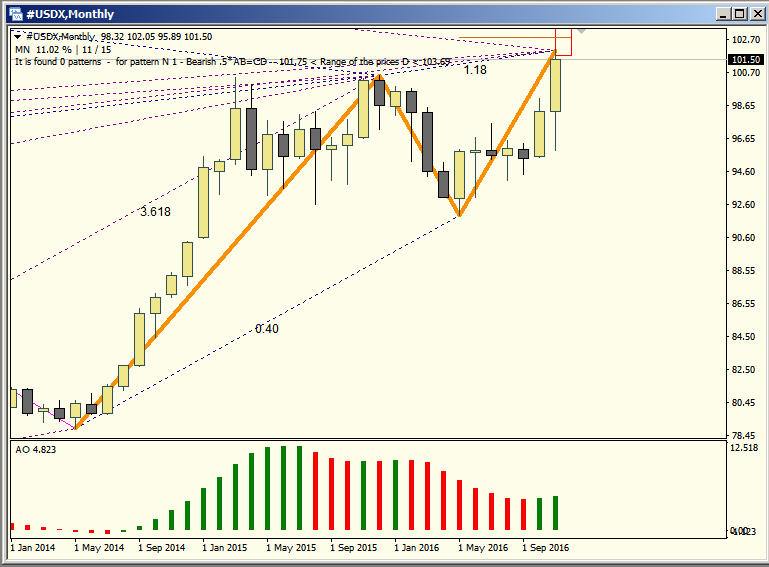
 As well as news from the web they offer some great charting news as shown in the diagram. You can drill down to see what candlesticks are showing on different  time frames currently.


The Heat Map is also current and updated frequently, a valuable tool when checking for trends.


In addition they offer ‘Social Trading’ which allows an investor to follow the trades of successful accounts and copy those into their own accounts.The My FxBook site is a very busy site based on the services which are offered, particularly the strategy analysis and news features.


Finance Magnates


This site is a huge news site devoted to many aspects of news for business as well as traders. It was originated in 2009 by Michael Greenberg, initially to cover the Forex industry and has since involved into a gigantic news source.
There are many different categories of news on the site, and also a huge selection of resources for business, developers and traders.
One very interesting section is the Interviews, videos of interviews with industry leaders.
Because there is so much to look at on the site and the news is being updated constantly, there is a sidebar showing the last article posted, this feature is very handy for someone looking through the site.
One aspect of the sitye that is a deterrent is that a lot of the pages take a while to load and that may prove to be annoying to some site visitors.


Sunday, November 27, 2016

Hidden Divergence AUDUSD

Hidden Divergence is great for pointing out what may be a trade that continues in the direction of the trend.


60 minute chart of AUDUSD


This chart shows a super specimen of Hidden Divergence doing what it is supposed to do.

While price had been making higher lows the oscillators had been making lower lows....... and sure enough price continued the upward trend.

For more about Hidden Divergence click here.

Gold Analysis as at November 27, 2016


Gold price has recently slipped to about a 9 month low, although today there is some sign of a recovery.


The decline in Gold is caused partially by the rise in the US Dollar and the prospect of rising interest rates in the next month or so.

There may be a further decline in months to come, however, currently it appears to be oversold and will probably rise.

Three charts below this paragraph indicate Fibonacci Patterns that are bullish. (Fibonacci Patterns do not have 100 percent reliability)

Weekly


Daily


4 Hour

Despite the good news about a rise in the price of Gold, there is reason for caution, as follows:

By Jordan Roy-Byrne, CMT, MFTA from Gold Seek  http://news.goldseek.com/GoldSeek/1480266000.php
Last week we wrote that the 2016 bull market in Gold and gold stocks had gone off course. It had moved too far out of the historical boundaries to remain a bull market. There was also other evidence of such including but not limited to rising real yields. Gold’s last hope was to hold $1200-$1210 and rebound back to the highs. It has broken bull market support ($1200-$1210 and $1230) and could be on its way to $1050 in the next few months.

US Dollar Index Update as at November 27, 2016


Bearish AB = CD


 US Dollar dropped back a little on Friday having reached a 13 year high on Thursday, it still ended up for the week.

There is great speculation that the US Federal Reserve may hike interest rates in December and there is anticipation of better economic reports on the horizon.

United States housing starts are at the highest rate since August of 2007.

Jobless claims are at their lowest since 1973.

All of these are contributing to a strong US Dollar.


Wednesday, November 23, 2016

Hidden Divergence Trading Strategy AUDUSD

The Aussie is about ready for a short entry.

AUDUSD 4 hour Chart
 The pair has already turned south and the divergences are very clear.

Note that the Kijun Sen and Tenkan Sen have crossed indicating an entry, however, I am a bit cautious at this point.

I would wait wait until the PPO (lowest chart) crosses to get confirmation.

The price of iron ore has increased substantially in the past couple days which boosted the currency, however the rise and strength of the US Dollar has offset that, hence my caution.


Video about Hidden Divergence


Ichimoku Kumo Renko Trading System Update as at November 23, 2016

A few pairs have broken out of the Kumo lately and led to some nice entries.

Here is a selection, note that the bars are ten pip Renko bars.


USDJPY is doing nicely after falling back to the Kumo a couple times.
USDJPY


NZDUSD climbed through the Kumo only to fall bac with the resistance being strong and now looks to go lower.
NZDUSD


AUDUSD has failed at the Kumo and dropped back
AUDUSD


EURUSD has fallen again with the sharp rise in the US Dollar recently
EURUSD


Canadian Dollar Update as at November 23, 2016

The Loonie is going lower this morning having climbed for a few days.

USDCAD
The strength of the US Dollar and  the weakness in the price of oil has caused the Canadian Dollar to fall.

Retail Sales in September have risen 0.6 percent while oil is falling away from recent highs.

Sweet Light Crude is just above $47.50 at this time and appears to be prepared to go further south.

The US markets have been quite strong lately based on expectations of the Trump government.


The remainder of this week will have little in the way of announcements in Canada.

News in the United States has been generally positive this week, stengthening the markets there.

Tuesday, November 22, 2016

Hidden Divergence Trading Strategy


Hidden Divergence as a trading strategy is a phenomenon that is occurring on every time frame almost every day and it offers a trader an easy way of spotting entries without spending a lot of time every day, especially if trading from a four hour chart.

There are some excellent books on Technical Analysis that cover Divergence,  First I would recommend Momentum, Direction, and Divergence By William Blau and Technical Analysis for the Trading Professional by Constance Brown.


We can regard Divergence as a leading indicator most of the time, it is a measurement of price action related by indicators such as OSMA and Stochastic Oscillator. Some people use Macd or RSI or CCI, I prefer the combination of OSMA and Stochastic.

I have an excellent discussion about divergences from the Ensign Software site as appeared in their newsletter in July 2002, written by Vaughan Kirkpatrick


Divergence Cheat Sheetby Vaughan Kilpatrick
It's about higher highs and lower lows.  If you find them in price, but not in the oscillator, you have regular divergence.  If you find them in the oscillator, but not in price, then it's hidden divergence.
Higher Highs => Short
Lower Lows => Long
At first this seemed to me like the opposite of common sense, so I had to think about it for a while.  I finally got it that it means when higher highs or lower lows in either price or an oscillator aren't confirmed by the other, then the direction indicated by the extremes, meaning the higher highs or lower lows, is weak and is likely to change.
If the higher highs or lower lows are in price but not the oscillator, then the direction of price is likely to reverse.  This is regular, or classic divergence and can be used as a confirming indicator for a reversal entry.

Regular divergence describes a price trend change that will probably happen in the future, albeit shortly.  On the other hand, hidden divergence is a confirming indicator of past price direction.
We have hidden divergence when we have higher highs or lower lows in the oscillator but not in price.  In this case the direction indicated by higher highs or lower lows in the oscillator is contradicted by the price trend.  Unlike regular divergence, where the weakness in price trend is about to lead to a reversal; here the weakness has already led to a little reversal against the trend.  The hidden divergence implies that this recent little reversal in price direction will be short-lived and that price will resume moving in the direction of the trend.  This is exciting because it can confirm a continuation entry, which is generally much less risky than a reversal entry.  What you have here is the opportunity to enter on a pullback of the current trend, which you expect to continue based on this and whatever other indicators you choose.  This is trading with the trend, nice and friendly; however, please heed the following warning.

Warning:  I consider divergence to be an indicator, not a signal to enter a trade.  It would be unwise to enter a trade basely solely on this indicator as too many false signals are given; however, on the other hand, I consider it even more unwise to trade against this indicator.
Thanks to NQoos for sharing his knowledge in the NQ/ES Paltalk room and providing so many wonderful examples of divergence in his great charts posted at www.dacharts.com.  Also thanks to Dave Shedd and Buffy for bringing us all together and for freely and generously sharing their time and knowledge.


SUMMARY OF FOUR TYPES OF DIVERGENCE

Regular Divergence:
  • Higher highs in price and lower highs in the oscillator which indicate a trend reversal from up to down.
  • Lower lows in price and higher lows in the oscillator which indicate a trend reversal from down to up.
Hidden Divergence:
  • Lower highs in price and higher highs in the oscillator which indicate a confirmation of the price trend which is down.
  • Higher lows in price and lower lows in the oscillator which indicate a confirmation of the price trend which is up.
On the diagram, the diagonal lines represent the trend lines drawn on a chart showing how each of the four patterns look with price above and the oscillator below.  On the two price lines, going either from right to left or left to right, the reversal of the diagonal lines shows the direction to be expected by each instance of divergence.  In each of the four instances of divergence, when price is headed up, green, chances are good it will turn down, red, and vice versa.

Copyright © 2003 - Ensign Software

Hopefully Hidden Divergence can become a part of your trading strategy toolbox.


In the next post I will present some current Hidden Divergences

Compare Forex Brokers

From time to time a trader will want to know if he is using the right broker for his style and needs. There is a huge number of Forex brokers to choose from. They are located in many countries and jurisdictions and have differing requirements.

I have located a couple sites that do some comparisons, in fact there are several sites that offer comparisons, lets have a look at a couple.

BabyPips.


Here is a partial look at their comparison screen


As you can see, there is a lot of detail available, you can compare up to three brokers at a time, great for decision making. You can access the BabyPips broker comparison here.


Compare Forex Brokers


This company does a comparison for a few Australian Forex brokers. They compare only a few criteria such as Low fees, High Leverage..... not really as good as what BabyPips seems to offer. The site is located here.


forex-brokers.credio


This company provides a comparison for more than 200 Forex Brokers using criteria such as Account size, Leverage and Spread. And they have a rating system.
Here is a look at their screen:


You can access their comparison here


Of course it is important whether you are an experienced or new trader to be absolutely comfortable with your choice of broker. It is a great idea to look at many firms and make your selection. Using these broker comparison screens may enhance your decision making.

There are many more places offering comparisons for Forex Brokers, these are merely an introduction as to what is available.

Monday, November 21, 2016

Gold Analysis as at November 21, 2016

Is There a Bottom Yet?


Gold has had a bit of a move upwards in the past couple days, perhaps the recent slide is finished.


Daily Gold Chart

Recent announcements  regarding interest rate rises and government expenditures in the US are causing some degree of uncertainty leading to a demand for Gold.

“Bets on a steeper Fed rate hike path after the U.S. presidential election have undermined demand for anti-fiat and non-interest-bearing assets,” including gold, said Ilya Spivak, currency analyst with Daily FX. “A lull in top-tier news flow may allow for a corrective retracement in the week ahead, but prices will probably remain highly sensitive to headline risk as the [President-elect Donald] Trump cabinet takes shape.”


Here is a chart of the US Dollar Index showing  some retrace as a result of the recent policies in the US. At this point traders are uncertain as to when interest rates may rise and there is some concern as to the budget proposals of the new President of the US.


US Dollar Index daily chart

Ichimoku Kumo Renko Trading System Update as at November 21, 2016


AUDUSD

AUDUSD
AUDUSD


The Aussie has fallen close to 6 percent since the US Election, partially due to the fall in the preice of Iron Ore and the prospect of a rate increase in the US.
Although there is a bit of a retrace occurring presently, some people expect the decline to continue to approximately .6500.
The Renko bars on this chart are ten pip bars, you can see that they contain the price action nicely.


EURNZD

EURNZD
EURNZD


This pair has reached what appears to be a double bottom and may be starting to reverse its fall. However, many expect the Euro to reach parity or close to it with economic and political uncertainty in Europe. Meanwhile the New Zealand Dollar seems to have discounted the recent earthquake although the damage is estimated at close to NZ$2.5 billion.


EURUSD

EURUSD
EURUSD


The US Dollar has been benefiting from expectations of an interest rate rise recently and some of the enthusiasm has started to wane a bit in recent trading. The run up has lasted for about ten days and traders have eased off on their  buying. You can see that price is entering the Kumo at this time, we will have to wait for a while to see if there is a long transaction.

You can see that the Renko bars combined with the Ichimoku Kumo make an excellent combination for scalping.

Thursday, November 17, 2016

Ichimoku Kumo Renko Trading System For Scalpers

Ichimoku Kumo Renko Trading System For Scalpers Can Be Easily Set Up.


Forex Chart with Renko and Ichimoku Kumo


This trading strategy using the Ichimoku Kumo (Cloud) Tenkan sen is a very profitable and simple scalping system. The first caution is that a stop loss must be used.

Chart Setup.

We need a 1 minute chart for each pair to be traded. I suggest only two or three charts as you will be busy when the markets are moving and there will be a lot of profits and opportunities for trade entries.
On each of those charts place the expert adviser for making offline charts and set the Renko brick size to three.
Here is an illustration of the Renko Expert Adviser settings

DaveM-0010


Once those are set up, open the offline charts and add the Ichimoku Kinko Hyo indicator as shown on the chart.
Here is a pic of the settings for the Ichimoku Kinko Hyo indicator for this system.


DaveM-0009


You can see that I have blanked out two of the components by changing their color to ‘none’.

The Trade Entries.

We enter when the price and Tenkan sen have crossed the Kumo…. sounds simple enough.
A proviso…….. if there is no trend…….. you will get stopped out. You will have to ensure a trend.
You can observe the Kumo and decide if the trend is satisfactory. With experience you will be able to spot the trend with ease.

DaveM-0011


DaveM-0012


DaveM-0013


DaveM-0014

Tuesday, November 15, 2016

Gold Analysis As At November 15, 2016

Overnight we have seen the metal move off it's lows and it is presently trading at 1225.67.

Interestingly enough there is still some ideas that Gold may move lower again, especially if the Retail reports from later this morning indicate that an interest rate increase may be coming. Later in the day we will hear from the Federal Reserve and that also may affect the price of Gold.

Traders will have to be very aware as to the value of the US Dollar in order to adjust their position in Gold.

Here are a couple charts showing Bullish Fibonacci Patterns on both 240 minute and daily charts of Gold.


Monday, November 14, 2016

US Dollar Jumped Higher Since Trump Elected

How Far Will The US Dollar Rise.?

Since the US Election on November 8, the US Dollar has moved much higher as traders are expecting higher inflation .

The Trump government will be favoring energies and manufacturing and traders are moving into these stocks.

Another factor pushing the Dollar higher is the rise in bond yields.

Of course the Trump Administration is not yet in place, there may be further developments as weeks pass.

Here is a 240 minute chart of the US Dollar Index, and you will see on there a bearish Fibonacci Pattern, perhaps a signal that the rise is finished. These patterns can not be relied on but it is an indication that there may be an overbought condition at this time.


On Tuesday November 15, there will be the following news releases which may further influence the US Dollar. (From Forex Factory)


Has Gold Price Reached A Bottom?

The Trump Effect


The election of Donald Trump has caused  some great volatility in the price of gold in the past few days, first a sharp rise and then a decline. Gold is trading near a several month low, however it seems to be reversing the decline this morning.

Charts


Here are some charts that may be showing that prices will be rising soon. There is, of course, no concrete method of forecasting, these charts are indicating only a possibility, only price action will tell if the metal will be moving higher or if it will be moving lower.


This first chart shows the Macd with Bullish Divergence, which may have been confirmed by the price rise in the Asian markets earlier today


 Support and Resistance is shown on this Harmonics chart, in fact the metal appears to be oversold at this time.


The Fibonacci Pattern, Bullish AB = CD supports the idea that price is ready to move higher.


Here is another Fibonacci Pattern on a Monthly Chart. Often an analyst will give a lot of credit to what may be appearing on longer time frame charts.


Gold price could break below $1200 on 'Trumpflation' fear - The Week UK
Mon, 14 Nov 2016 10:00:15 GMT
The gold price recovered in Asian trading overnight, rising around one per cent to $1,224 an ounce before the start of the European trading session this morning. However, ...
Read more ...


Gold Prices Reach Five-Month Low - Wall Street Journal
Fri, 11 Nov 2016 21:10:00 GMT
Gold prices fell to a five-month low Friday as appetite for riskier investments improved after Donald Trump's victory in the U.S. presidential election, damping demand for haven as ...
Read more ...


Gold Weekly Analysis - DailyForex.com
Mon, 14 Nov 2016 06:17:36 GMT
Gold ended the week down $67.29 at $1225.59, as a stronger U.S. dollar and increased appetite for riskier investments dampened demand for the metal. The market rallied all the way to the $1337 area on D ...
Read more ...


Technical analysis: Gold tumbles. Moves away from MA levels - ForexLive
Fri, 11 Nov 2016 15:57:49 GMT
ForexLiveFounded in 2008, ForexLive.com is the premier forex trading news site offering interesting commentary, opinion and analysis for true FX trading professionals. Get the latest ...
Read more ...


Krugman Gets His Alien Invasion – And Gold Bugs Get Paradise - Gold Seek
Sun, 13 Nov 2016 21:22:32 GMT
Gold SeekNobel Prize winning economist and uber-liberal New York Times columnist Paul Krugman likes to illustrate his philosophy by noting that the threat of an alien invasion would ...
Read more ...


Copper calls Gold Bottom on Trumphoria Surge... - Gold Seek
Sun, 13 Nov 2016 21:27:43 GMT
Last week was highly unusual. Despite not winning the popular vote, Trump won more seats than Hillary Clinton and ended with a clear majority, contrary to what opinion polls projected. ...

Read more ...