Showing posts with label Ichimoku. Show all posts

Friday, August 14, 2015

Ichimoku Renko Trading Strategy


You will find this Renko Strategy to be extremely simple and also very profitable as a quick scalping method. Once again, the indicators for this system are included in most trading packages or are freely available for download on the internet.

The only indicator I use for this method is the Ichimoku Kinko Hyo and I just use the Ichimoku Cloud and Tenkan Sen.

The Renko blocks are three (5) pips, they move quickly when the markets are busy.

The Strategy

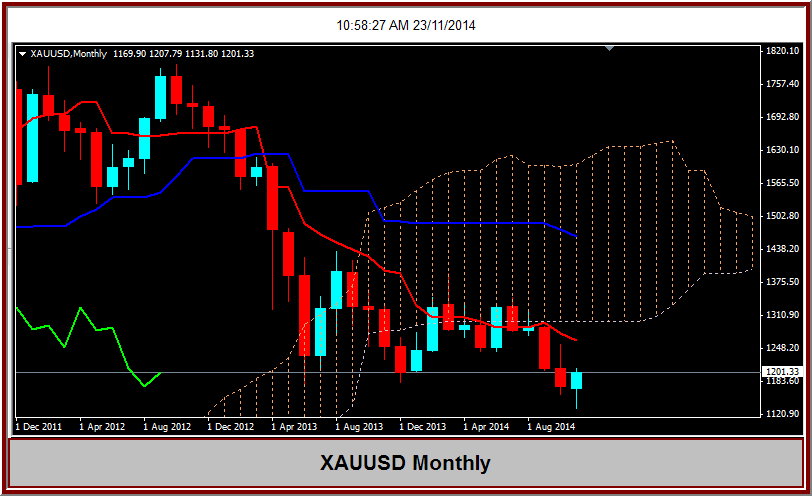
You can see from the chart how well this method allows a trader to follow the trend.
For a long entry – price is above the Tenkan and also above the Kumo
For a short entry – price is below the Tenkan and also below the Kumo.
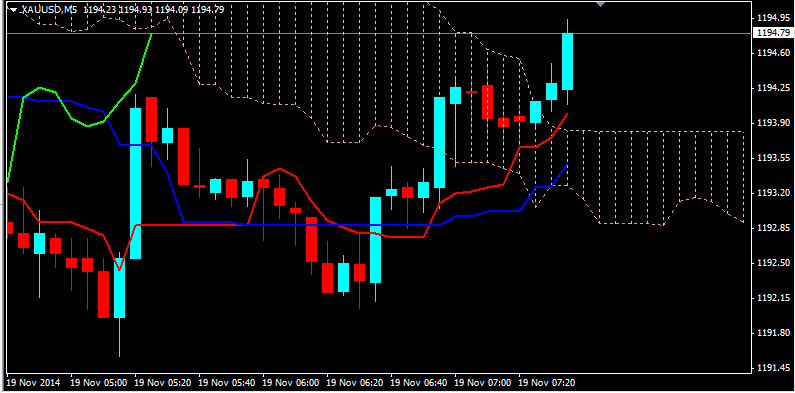
As you can see, the Renko bars point out clearly the places for adding to positions or re entry.

image

image

I put some arrows on this next one to show a couple entries.
image

For myself, I have been trading for many years, longer term trading and also day trading. I find this method of using the Ichimoku cloud and fast Renko Bars to be quite effective and profitable. The simplicity of this method allows me to have several charts open at once so as to make trades on different currency pairs simultaneously..

Of course a person can not expect to master this set up in a few minutes, it will take many hours of screen time and demo trading to get used to it.

Keep in mind that the better trades are made in a market that is trending with volume. I suggest that you look at another currency when the Kumo is flat in order to avoid the irritation of your stop being met.
In a future post I will discuss this method with CFD’s, it works just as well with all nature of CFD’s.

Enjoy!

Friday, January 16, 2015

Gold Ichimoku Trading Strategy as at January 15, 2015

Gold has experienced a nice upward move in the past few days, it is time to examine the trading strategy with a view to support and resistance.

The Ichimoku Cloud does a great job of demonstrating potential support and resistance. We will have a look at  some different time frames to see what may be in store for the metal.

The first chart is the monthly. You can see that price is approaching the resistance of the cloud and if you look back a few bars you can see that it has attempted to go through the cloud more than once and been rejected.


This is the weekly chart, once again price is approaching the cloud. At this point the cloud is not very thick and may not present much resistance.


The daily and 4 hour charts show that price is above the cloud which will be acting as support.


Some additional commentary on Gold


Jeff Gundlach Webcast, January 13 - Business Insider

http://www.businessinsider.com/moneygame Tue, 13 Jan 2015 13:07:45 -0800
The best commodity in 2014 was gold. Screen Shot ... Gold gained ground in basically every currency except the US dollar in 2014. ... "Gold is on a stealthy rally and I suspect gold is going to be headed higher not lower." ...

Read more ...


Sat, 10 Jan 2015 00:57:00 -0800
Contrarian, gold & precious metals. Profile| Send Message|. x. Author Following Options: Follow this author. See their articles on your Seeking Alpha homepage and in your feed. Real-time alerts on this author. Get their new ...


Thursday, January 15, 2015

EURUSD - USDDKK Trading Strategy

These pairs move opposite to each other and today we see a sign of a reversal starting. Many traders have a strategy of trading these simultaneously, a profitable trading strategy for sure..

Note the long wicks on today's candles, certainly there will be a reversal in coming days.

The Eurusd pair has moved a long way from the low in a few hours.


Wednesday, January 14, 2015

USDJPY Ichimoku Chart Of The Day


Price is starting to test support of the Ichimoku Cloud. This will be interesting as economic reports appear later in the day.


USDJPY holding 117.00 as Nikkei falls again - ForexLive (blog)
Wed, 14 Jan 2015 05:56:45 GMT
USDJPY holding 117.00 as Nikkei falls againForexLive (blog)Mike Paterson has more than 30 years of experience trading FX including key market-making roles as a senior spot trader with UBS and Credit Suisse. He was also head of FX at the State Bank of ...


Read more ...


USD/JPY Technical Analysis: Support Below 118.00 Pressured - DailyFX


Tue, 13 Jan 2015 23:56:45 GMT
USD/JPY Technical Analysis: Support Below 118.00 PressuredDailyFXThe US Dollar is testing the bottom of now-familiar range support below the 118.00 figure against the Japanese Yen once again. Near-term support is at 117.91, the 23.6% Fibonacci retrac ...


Read more ...

Sunday, November 23, 2014

My Gold Trading Strategy as November 23, 2014

The new week is about to test our trading strategies. Governments will be making their moves, traders will be in and out of the market and who knows what is coming for Gold.

There are a lot of opinions, Gold is going to $5,000 and Gold is dropping to $800, I will post some opinions further down in this post.

First I will post a couple charts, Ichimoku Kinko Hiyo charts, reason being is, they have something to tell us about support and resistance.

Here is the daily chart of XAUUSD


It is easy to see that the is going to be resistance at the Ichimoku Cloud. It appears that the Cloud becomes narrower as days pass, maybe resistance to a price rise will lessen.


The weekly chart is next.


Once again we see the Ichimoku Cloud creating resistance although the Cloud is much thinner than on the daily chart.


Finally, the Monthly chart.


It took a couple months for price to break down through the Cloud and then finally support was broken. The November bar has a long wick, showing that the bulls are making progress....


As mentioned earlier in the post, I found some recent articles and opinions about Gold as follows:


Russia's Central Bank Buying Gold Isn't Quite What You Think It Is - Forbes

Sat, 22 Nov 2014 11:42:03 GMT
The Russian central bank has been buying more gold this year. This could be taken as some form of support for the price of gold, could be taken as simply the bank deciding that t ...

Read more ...


Swiss Central Bank Chief Warns on Impact of Gold Vote - Wall Street Journal
Sun, 23 Nov 2014 13:31:49 GMT

ZURICH—The head of the Swiss National Bank reiterated concerns that a popular vote on requiring the central bank to keep a fifth of its assets in gold would hi ...

Read more ...


Gold No Longer Slumbers - Barron's
 Sat, 22 Nov 2014 03:15:13 GMT

But after pummeling gold steadily lower from its peak around $1,900 an ounce in September 2011, he is showing signs that he could be done dumping on the metal, which hit a low of $1,131.85 an ounce this month. Gold-mini ...

Read more ...


Many are seeing the moves by China as bullish for the price of Gold.

Chinese rate cut pushes gold, silver to highs - Resource Investor
Sun, 23 Nov 2014 11:44:43 GMT

The rate reduction was the first since July 2012 as the Asian nation heads toward its slowest full-year expansion in almost a quarter century. Russia added to gold reserve ...

Read more ...


This infographic is really well done!

InfoGraphic on the Swiss Gold Referendum to take place on November 30th - CoinWeek

Sun, 23 Nov 2014 14:37:40 GMT

On November 30, Swiss nationals head to the polls on three separate issues: abolishing a flat tax on resident, non-working foreigners, an immigration cap, and a proposal o ...

Read more ...


Gold / Silver / Copper futures - weekly outlook: November 24 - 28 - Investing.com
Sun, 23 Nov 2014 13:38:11 GMT

Despite Friday's upbeat performance, gold prices are likely to remain vulnerable in the near-term amid indications a strengthening U.S. economic recovery will force the Fed ...


Read more ...


Good Trading in the week ahead...!


Wednesday, November 19, 2014

My Gold Trading Strategy as at November 19, 2014

The Gold Trading Strategy has to be Long, at least at this time.

The price is moving higher rapidly.

I have attached two Ichimoku charts, a 5 minute chart and a 15 minute chart.

First the 5 minute chart:

You will see that price has jumped up through the cloud and is moving higher.


Next, have a look at the 15 minute chart.

You will see that price is approaching resistance at the cloud and the question will be whether or not the upward move is strong enough to push through the cloud. Only time will tell


Of course, on the higher time frames is a lot more resistance, We will know as the hours pass as to what will happen.

The Ichimoku Cloud is sometimes very powerful support or resistance, it is handy to have a look at it before making any moves to get an idea as to what may befall any move in the price.

While the Ichimoku chart may not be favored by many traders, it is certainly a significant part of my trading strategy at this time.

Good Trading..!

Sunday, November 16, 2014

Ichimoku Trading Strategy Chart of the Day, November 17, 2014


AUDNZD: After a pair of Dojis there is a Tenkan cross and price is dropping, a clear signal for a short entry.

There had been significant support holding price up for many days and the Ichimoku Cloud could not be breached with many attempts. At last price was able to break through the cloud and there should be a good move resulting.

Ischimoku Kinko Hiyo is an excellent trend trading strategy used by many banks and institutional traders.

Saturday, November 8, 2014

How Can Ichimoku Help Your Trading Strategy?

The Ichimoku indicator is a complete trading system in itself and several master traders, including people trading for funds and banks use it for their trading strategy.

I am not going into the development of this system in this post, instead I want to illustrate my use of the Ichimoku cloud.

Let's have a look at a chart:


I have placed 4 arrows on the chart, the first two point to two things, the first being the thickness of the cloud and the second being the two attempts to break through the support. Of course the thin cloud is not going to offer a great support and price can break through easily.

The third and fourth arrows are meant to illustrate that the cloud is becoming thicker and there will be stronger resistance for price to cross in that area. That tells us that a quick rise in price may be difficult to accomplish. Notice that the cloud is extended 26 bars into the future, gives us an idea as to what may be coming.


Here is a chart on Google.


On this chart I have again placed 4 arrows. The first three illustrate the support, three times price tried to break support offered by the cloud and finally on the fourth attempt was able to break through. The fourth arrow shows a thin area of the cloud that price was easily able to break. You will notice if you take time that it often takes more than one attempt to get through the cloud.


One more chart. This chart is the SPX.


Again 4 arrows!. The first two demonstrate the hesitation at support, the third shows the long wick as the buyers took control at the support level and the last one shows..... price had no regard whatsoever for the resistance of the cloud and burst right through it. I think that confirms that we can not rely solely on an indicator, that we must always use price action for decision making.

I have some resources regarding Ichimoku trading strategies, here are a couple links.

The first is StockCharts.com .

Also Investopedia .

Enjoy your day..!!