Table of Contents
- Introduction to TradingView Demo Account
- Exploring Charting and Technical Analysis
- Utilizing Advanced Drawing Tools
- Managing Watchlists and Alerts
- Analyzing Indicators and Strategies
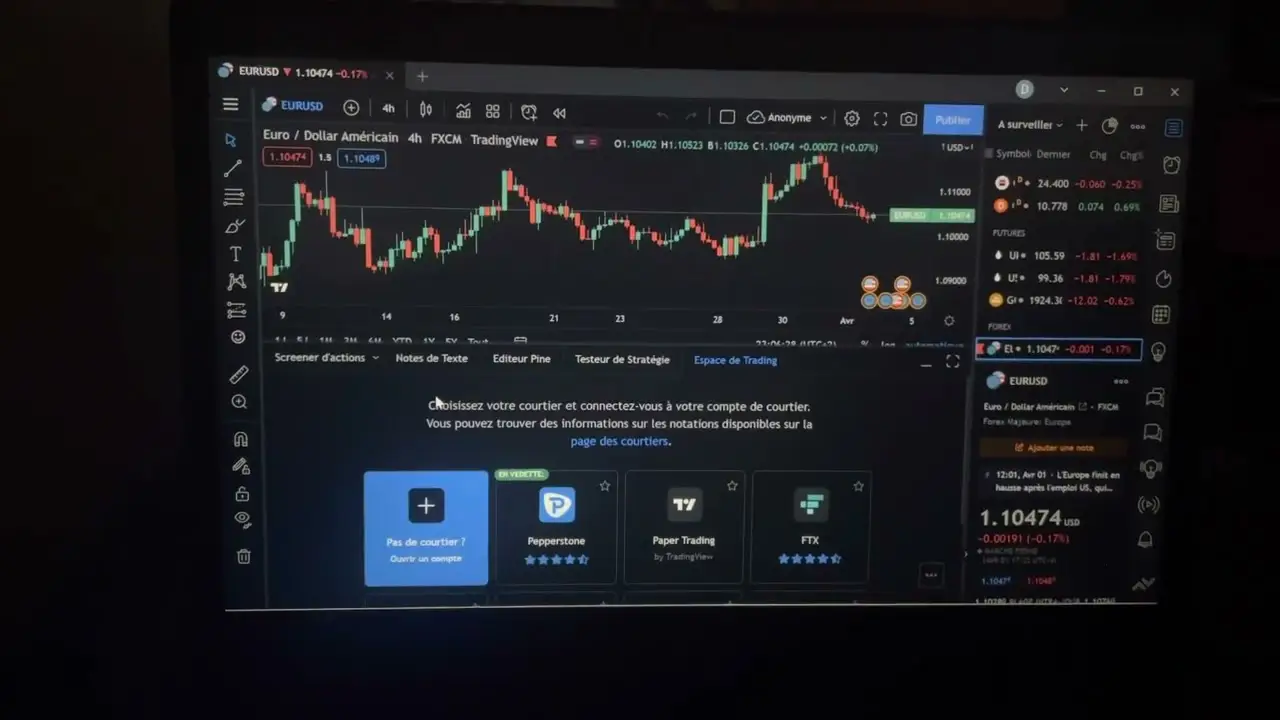
- Simulating Trades with Paper Trading
- Enhancing Collaboration with Social Features
Introduction to TradingView Demo Account
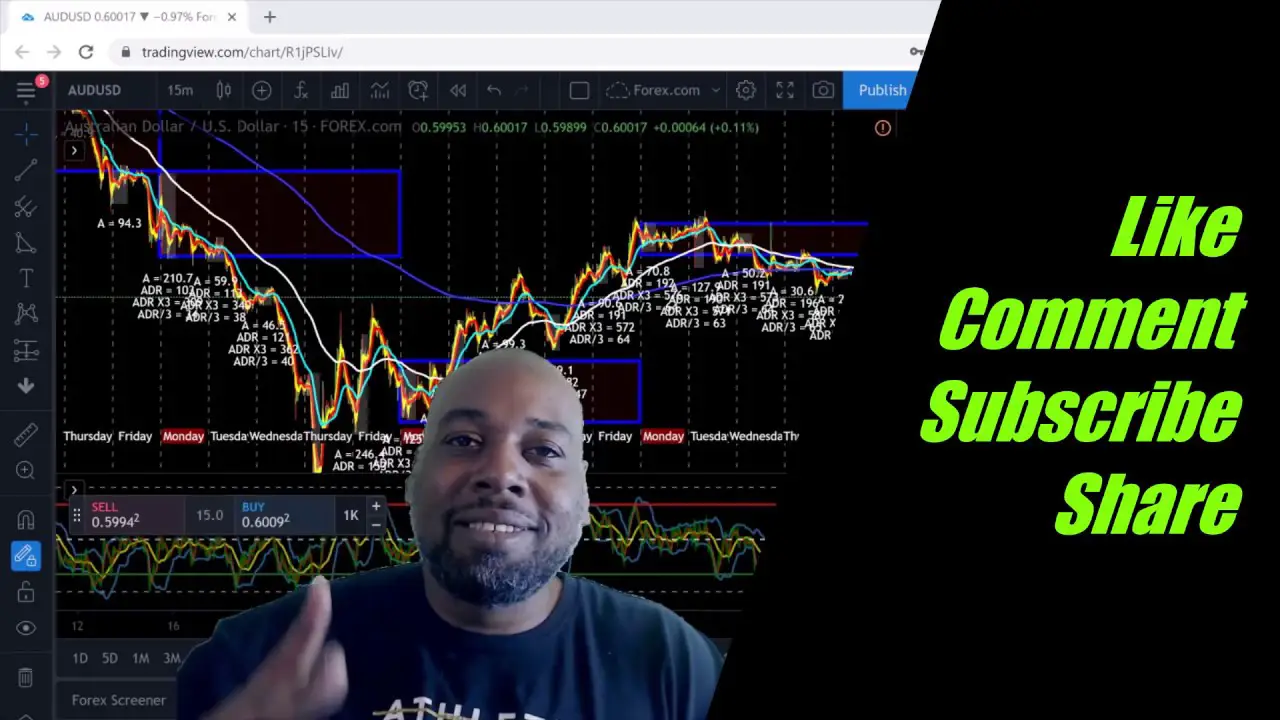
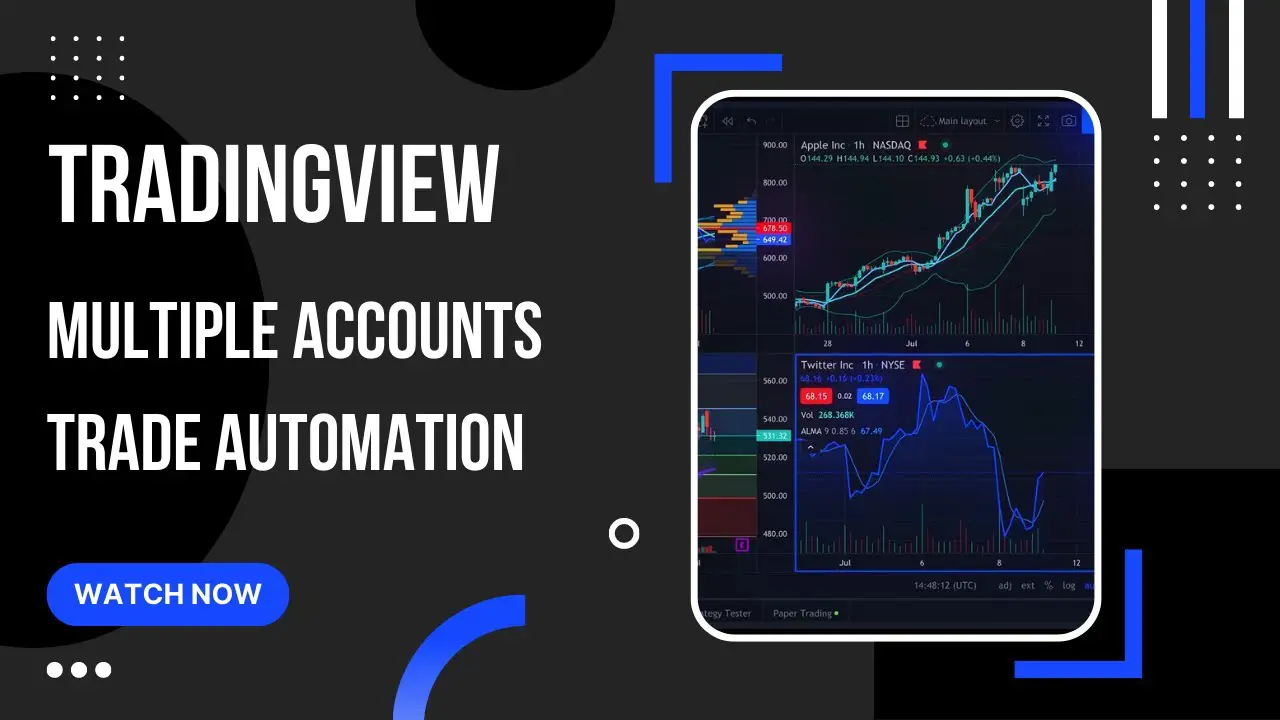
TradingView is a leading online platform that provides traders and investors with advanced charting tools, technical analysis indicators, and an active social community. This comprehensive guide aims to introduce you to the TradingView demo account and its multitude of features designed to help you refine your trading strategies.
Exploring Charting and Technical Analysis
In this section, we will delve into the powerful charting capabilities offered by TradingView. Discover how to access and analyze different types of charts, customize timeframes, apply technical indicators, and make informed trading decisions based on price movements.
If you are interested in trading and want to gain insights into technical analysis and charting, using a TradingView demo account is a great way to start.
Charting
TradingView provides a user-friendly interface that allows you to easily create interactive and customizable charts. With a variety of chart types, such as line, bar, and candlestick, you can analyze historical price data and identify trends or patterns.
Technical Analysis
TradingView offers a wide range of technical analysis tools and indicators to help you make informed trading decisions. From simple tools like trendlines and support/resistance levels to complex indicators like moving averages and stochastic oscillators, you can apply various techniques to analyze price movements and predict future trends.
Demo Account
By using a TradingView demo account, you can explore these charting and technical analysis features without risking real money. The demo account provides a simulated trading environment where you can practice implementing different strategies, experimenting with various indicators, and honing your skills.
Benefits
Exploring charting and technical analysis in a TradingView demo account offers several advantages:
- Zero financial risk: You can freely experiment and learn without the fear of losing real money.
- Educational resources: TradingView provides educational materials, webinars, and a community forum where you can interact with other traders and gain valuable insights.
- Real-time market data: The demo account utilizes live market data, enabling you to analyze current market conditions and test your strategies accordingly.
- Customizable settings: You can personalize the appearance and functionality of your charts and indicators to suit your preferences and trading style.
Using a TradingView demo account allows you to delve into the world of charting and technical analysis, helping you gain proficiency and confidence in your trading endeavors. Whether you are a beginner or an experienced trader, exploring these features can enhance your understanding of the market and improve your trading strategies.
Utilizing Advanced Drawing Tools
Learn how to effectively use TradingView's extensive set of drawing tools to annotate charts, draw trendlines, add shapes, and make personalized notes. These features are essential for identifying patterns, support and resistance levels, and visualizing potential trading opportunities.
In the TradingView demo account, traders have access to a range of advanced drawing tools that can greatly enhance their technical analysis. These tools allow users to analyze and predict market movements more effectively.
1. Trend Lines
Trend lines are an essential tool for identifying and confirming trends in the market. By drawing a line that connects consecutive higher lows in an uptrend or lower highs in a downtrend, traders can gain valuable insights into the direction of price movements.
2. Fibonacci Retracement
The Fibonacci retracement tool helps traders identify potential levels of support and resistance based on the Fibonacci sequence. By drawing a retracement line between a swing low and swing high, traders can determine areas where price may retrace before continuing its trend.
3. Elliott Wave
The Elliott Wave tool is based on the theory that price movements in the market follow a predictable wave pattern. Traders can draw different wave patterns, such as impulse waves and corrective waves, to identify potential entry and exit points.
4. Gann Fan
The Gann Fan tool is useful for predicting future support and resistance levels. By drawing three diagonal lines on a chart, traders can analyze price movements in relation to the fan angles and anticipate possible turning points in the market.
5. Pitchfork
The Pitchfork tool is widely used for drawing channels that indicate potential areas of support and resistance. Traders can draw parallel lines based on three points, and these lines can act as reliable reference levels for making trading decisions.
By mastering these advanced drawing tools in the TradingView demo account, traders can enhance their technical analysis skills and make more informed trading decisions. Remember to practice using these tools with caution and always consider other factors such as fundamental analysis and risk management.
Managing Watchlists and Alerts
Master the art of creating and managing watchlists to monitor your preferred financial instruments closely. Additionally, we will explore how to set up customized alerts that notify you when specific conditions or events occur in the market.
In the TradingView demo account, users have the ability to manage watchlists and set alerts to stay updated on market movements. This feature allows traders to track multiple securities simultaneously and receive timely notifications for important events.
Creating a Watchlist
To create a watchlist in TradingView, follow these steps:
- Click on the "Watchlist" tab in the top menu.
- Click on the "+" button to add a new watchlist.
- Enter a name for your watchlist.
- Search for and add the desired symbols to your watchlist.
Editing a Watchlist
TradingView also allows users to edit their watchlists easily:
- Go to the "Watchlist" tab.
- Select the watchlist you want to edit.
- Add or remove symbols from the watchlist.
- Drag and drop symbols to reorder them.
Setting Alerts
Alerts can be set to receive notifications when certain market conditions are met. Here's how to do it:
- Navigate to the desired chart in TradingView.
- Click on the "Alert" button located at the top of the chart.
- Select the criteria for the alert (e.g., price crossing a specific level, indicator values).
- Specify the alert condition and the notification method (e.g., email, popup).
- Click on the "Create" button to set the alert.
Managing Alerts
Once alerts are set, they can be managed efficiently in TradingView:
- Go to the "Alerts" tab in the top menu.
- View the list of active alerts and their conditions.
- Enable, disable, or delete alerts as needed.
- Modify alert conditions by clicking on the edit icon.
By effectively managing watchlists and alerts, traders can stay informed about the market movements that matter to them and take advantage of potential trading opportunities in their TradingView demo account.
Analyzing Indicators and Strategies
TradingView offers a wide range of built-in indicators and allows users to create and customize their own indicators and trading strategies. We will discuss how to leverage these tools to gain insights into market trends, confirm trade signals, and improve your overall trading performance.
Welcome to the TradingView demo account where you can practice analyzing indicators and strategies to enhance your trading skills. In this demo account, you have access to various tools and features to analyze the financial markets.
Indicators
TradingView offers a wide range of indicators that can be applied to charts to provide insights into market trends and patterns. These indicators include Moving Averages, Relative Strength Index (RSI), Bollinger Bands, MACD, and many more. By studying these indicators, you can make more informed decisions when trading.
Strategies
With the TradingView demo account, you can create and test your own trading strategies using the Pine Script programming language. Pine Script allows you to define custom indicators, develop trading algorithms, and backtest your strategies against historical data. By experimenting with different strategies, you can find approaches that suit your trading style.
How to Use
To get started, simply select the desired market from the list of available instruments and add indicators to your chart. You can customize indicator settings and adjust their parameters to fit your trading preferences. Once you have analyzed the indicators, you can devise and implement your trading strategy based on the insights gained.
Remember that this is a demo account, and any trades made within the account do not involve real money. Therefore, you can practice risk-free and experiment with various indicators and strategies to improve your trading skills.
Start exploring the features of the TradingView demo account today and sharpen your trading analysis skills. Happy trading!

Simulating Trades with Paper Trading
Practice trading without risking real capital by using TradingView's paper trading feature. Discover how to execute simulated trades, test your strategies in different market conditions, and track your performance to fine-tune your approach before venturing into live trading.
TradingView offers a powerful paper trading feature in their demo accounts, allowing users to simulate trades and practice their trading strategies without risking real money. This invaluable tool enables traders to gain experience, test various techniques, and refine their skills before venturing into live trading.
With the paper trading feature, traders can execute virtual trades in real-time using historical price data, just as they would in a live trading environment. This creates a realistic simulation, allowing traders to assess the performance of their strategies without any financial consequences.
Setting up paper trading in TradingView is simple. Users can create a demo account, which provides access to all the features of a regular account. Within the trading platform, they can choose a desired asset, enter the desired trade details (such as quantity, entry and exit prices, stop loss, take profit, etc.), and execute the trade virtually.
The paper trading feature also provides comprehensive performance metrics, enabling traders to analyze their trades and track their progress. This includes metrics like profitability, win rate, average gain/loss, and maximum drawdown, which can help traders identify strengths and weaknesses in their strategies.
In addition to individual trade simulations, traders can also create and backtest complex trading strategies using TradingView's powerful scripting language, Pine Script. This allows traders to automate their trading strategies and evaluate their performance over a specific period.
Overall, simulating trades with paper trading in a TradingView demo account is an essential step for traders looking to develop and fine-tune their trading skills. It provides a risk-free environment to practice, analyze, and optimize strategies before putting real money on the line in live trading.
Enhancing Collaboration with Social Features
Uncover the power of TradingView's social features that enable traders and investors to share ideas, interact, and learn from one another. Engage with the community through comments, private messaging, publishing charts, and following influential traders to enhance your trading knowledge and network.
TradingView is a powerful online trading platform that provides users with advanced tools and features for technical analysis. In addition to its comprehensive charting capabilities, TradingView also offers various social features to enhance collaboration among traders.
1. Social Network
TradingView's social network allows traders to connect with other like-minded individuals, follow their trading activities, and exchange ideas. By building a network of traders, users can benefit from shared insights, trading strategies, and market analyses. It promotes an environment of collaboration and learning, where traders can grow together.
2. Comments and Discussions
Within the TradingView platform, users can engage in discussions and comment on specific charts or trading ideas. This feature enables traders to provide feedback, ask questions, or share their perspectives. It fosters an interactive community, where different viewpoints are valued and contribute to the collective knowledge base.
3. Idea Sharing and Publishing
TradingView allows users to create and publish their trading ideas, which can be seen by others in the community. By sharing their insights, users can receive feedback, constructive criticism, or even validation of their analysis. It encourages traders to think critically and communicate their thoughts effectively, ultimately leading to improved trading strategies.
4. Social Alerts and Notifications
TradingView offers social alerts and notifications, keeping traders updated with the latest activities and developments within their network. Users can receive real-time alerts on trades, comments, or ideas from other traders they follow. This feature ensures that traders stay connected and informed, enabling prompt reactions to market changes or emerging opportunities.
5. Collaborative Workspace
TradingView's collaborative workspace allows users to work together on chart analysis or trading ideas. Multiple traders can contribute simultaneously, making annotations, sharing indicators, or discussing strategies in real-time. It enhances teamwork and encourages the exchange of knowledge, ultimately leading to improved trading performance.
With these social features, TradingView creates a vibrant community of traders, fostering collaboration, learning, and innovation. Whether you are a beginner or an experienced trader, TradingView's social features empower you to connect with others, gain valuable insights, and enhance your trading skills.
Key Takeaways
- TradingView offers a comprehensive demo account to explore its powerful features.
- The platform provides advanced charting tools and technical analysis indicators.
- Utilize the extensive set of drawing tools to identify patterns and trading opportunities.
- Manage watchlists and set up custom alerts to stay informed about market conditions.
- Analyze built-in indicators and create personalized strategies to improve trading performance.
- Practice trading with paper trading before engaging in live trading.
- Engage with the TradingView community through social features for enhanced collaboration.
FAQ
1. Can I access TradingView demo account for free?
Yes, TradingView offers a free demo account that allows you to explore and experience most of the platform's features. Some advanced features may require a subscription.
2. Is the data in the TradingView demo account real-time?
The data provided in the demo account is delayed, typically by 15 to 20 minutes. Real-time data is available for paid subscribers.
3. Can I import my own data into TradingView charts?
Yes, TradingView allows you to import and overlay your own data on the charts. This feature enables you to conduct thorough analysis using your proprietary data alongside the platform's tools.
4. Can I access TradingView on my mobile device?
Absolutely! TradingView has mobile applications available for both iOS and Android devices. You can access your demo account and manage your charts and analysis on the go.
5. How long can I use the TradingView demo account?
The TradingView demo account has no expiration date. You can use it for as long as you need to explore and familiarize yourself with the platform's features.
No comments:
Post a Comment