Gold closed the week at just over $1,287.00, a nice increase in price for the week, close to $100.00 since mid-March.
The supposed ‘PipeLine War’ in Syria and the Middle East has contributed as has the North Korean discussion. Uncertainty is building as the United States is bombing Syria and Afghanistan.
Some market experts are feeling that equities may be well over-priced, causing investors to seek safety in Gold.
Others are starting to think that there is going to be some future economic disruption and that a long-term bull market for Gold and other metals will appear.
New demand for Gold comes from the Muslim community, Gold can now be included in Shariah compliant accounts and the demand for Gold could become equivalent to half of the annual Gold production.
Production may well be inadequate in future to meet demand, even as new mines open and closed mines reopen due to Muslim demand and rising standard of living in the Asian Nations.
Here is a look at some charts for the short term and longer term
First, we have a Point and Figure chart

On this 240 minute chart is a bearish pattern, indicating that we may see a reversal from the recent rise

The Daily chart has another bearish pattern, confirming the bearish pattern on the 240-minute chart above

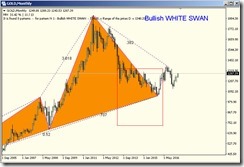
The Monthly chart has a Bullish Pattern and that may be the one with the greatest influence as the week's pass.

One proviso – these patterns do not always produce what we expect, they are merely indications as to what we may see, nothing definite.
A further look is on the Ichimoku Kinko Hyo Charts
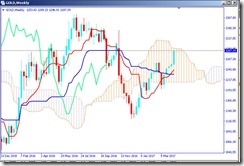
The Weekly Chart shows the price moving towards the top of the cloud. Resistance is strong in the cloud, there is no guaranty that this bullish movement will continue.

On the Monthly Ichimoku Chart, the price is just approaching the bottom of the cloud, again, resistance in the cloud area is strong, we may see a downward reversal.
One last chart, the Bill Williams system Monthly chart.
As you can see, the moving averages are intertwined, the volatility on this chart is negligible, showing that the market is range bound no trend…… Indecision.

There we have several looks, several different approaches depending on the time frames.
We will have to wait for the market to show us what investors are thinking as the new week appears.
Good Trading..


No comments:
Post a Comment