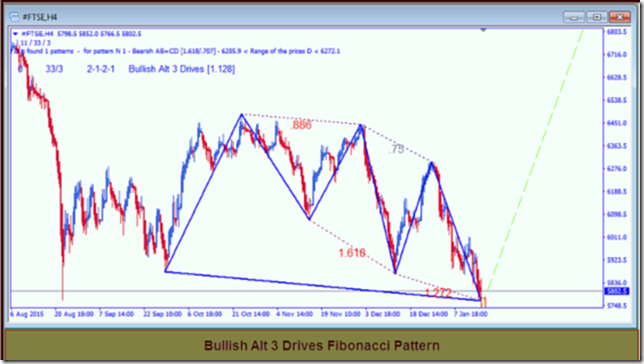
This Fibonacci Pattern on the 240 minute chart could be showing the end of the drop in the FTSE.

The Bullish Alt 3 Drives Fibonacci Pattern, not as precise as the regular 3 Drives Pattern is nonethe less based on significant Fibonacci numbers.
As you can see in the chart, this pattern has sequence of .886 1.618 and 1.272 which are generally regarded as significant in the formation of a Fibonacci Pattern.
This particular Pattern spans the period from the end of September until now making it a relatively strong Pattern and I expect to see the price on the FTSE start to move higher in coming days.
The FTSE index is an Index of 100 companies listed on the London Stock Exchange. For more information on the Index you can refer to Wikipedia at this page.
I am attaching a weekly chart which shows two things…..
Notice the Bullish Divergence on the Macd Histogram and the double bottom…… two signs that the decline is about to end.


No comments:
Post a Comment