Bullish Divergence is being observed by many traders daily as they are seeking market reversals.
It is usually located by noticing the movement of an oscillator such as Macd or CCI or Stochastic.
In this guide you will find many sources of information abouit Bullish Divergence and those ideas will assist your trading.
Studying a Bullish Divergence Trading Strategy will enhance your trading, particularly if you like to see what the end of a downtrend looks like.
Oscillators tend to be somewhat misunderstood in the trading industry, despite their close association with the all-important concept of momentum. At its most fundamental level, momentum is actually a means of assessing the relative levels of greed or fear in the market at a given point in time. Markets ebb and flow, surge and retreat - the speed of such movement is measured by oscillators.
Oscillators are most useful and issue their most valid trading signals when their readings diverge from prices. A bullish divergence occurs when prices fall to a new low while an oscillator fails to reach a new low. This situation demonstrates that bears are losing power, and that bulls are ready to control the market again - often a bullish divergence marks the end of a downtrend. Bearish divergences signify potential downtrends, when prices rally to a new high while the oscillator refuses to reach a new peak. In this situation, bulls are losing their grip on the market, prices are rising only as a result of inertia, and the bears are ready to take control again.
Types of DivergencesDivergences, whether bullish or bearish in nature, have been classified according to their levels of strength. The strongest divergences are Class A divergences; exhibiting less strength are Class B divergences; and the weakest divergences are Class C. The best trading opportunities are indicated by Class A divergences, while Class B and C divergences represent choppy market action and should generally be ignored.
Class A bearish divergences occur when prices rise to a new high but the oscillator can only muster a high that is lower than exhibited on a previous rally. Class A bearish divergences often signal a sharp and significant reversal toward a downtrend. Class A bullish divergences occur when prices reach a new low but an oscillator reaches a higher bottom than it reached during its previous decline. Class A bullish divergences are often the best signals of an impending sharp rally.
Class B bearish divergences are illustrated by prices making a double top, with an oscillator tracing a lower second top. Class B bullish divergences occur when prices trace a double bottom, with an oscillator tracing a higher second bottom.
Read more:
When an indicator “fights” with the actual price action traders can profit.
Sometimes a technical indicator will disagree or “fight” with the actual price action of the stock or index you are analyzing. These “disagreements” are actually very useful for technical traders. In this three part series we will discuss and learn how to apply these powerful technical signals called divergences
A divergence appears when a technical indicator (usually an oscillator) begins to establish a trend that disagrees with the actual price movement. For example, in the chart below you can see the QQQQ forming lower lows from January through March of 2008.
This is representative of a market that is becoming more bearish. However, the RSI technical indicator I have applied is showing a series of higher lows, which is indicative of an improving trend.

For QQQQ shorts, this is a warning that risk control is going to become much more important because there is a high probability that the trend will be disrupted in the short term.
For more speculative traders looking to get long the QQQQ or buy calls, this “bullish divergence” is an alert that a change in the trend may be emerging. In the video I will cover another great example of a bullish divergence like the one on the QQQQ but on an individual stock.
Traders use technical indicators like oscillators because they filter a lot of the noise within the price action. Oscillators are typically designed to show a trader when prices have reached extremes and a reversal is likely. However, how extreme is too extreme?
The disagreement or divergence between bearish price action (lower lows) and the trend of the oscillator (higher lows) is one way to answer that question. When this happens it indicates that investor sentiment is too extreme and a reversal to the upside is likely.
Divergences can happen to trigger trades both directions.
Divergences can be an important warning signal that a bullish trend is ending. In the last article I talked about how to use bullish divergences to time an entry into a new long position or to look out for weakness in a downward trend but there are also bearish divergences that long traders need to watch for.
Besides describing a bearish divergence I will further refine divergence analysis, in this article, to help you understand what types of divergences matter most and what you should be looking for on a day to day basis.
What if you were already in a long position and you could know ahead of time the perfect place to exit instead of watching your unrealized gains, a.k.a your potential Aston Martin down payment, vanish before your eyes because your trade reverses direction?
What if you believe a currency pair will continue to fall but would like to short at a better price or a less risky entry?
Well guess what? There is a way! It’s called divergence trading.
In a nutshell, divergence can be seen by comparing price action and the movement of an indicator. It doesn’t really matter what indicator you use. You can use RSI, MACD, the stochastic, CCI, etc.
The great thing about divergences is that you can use them as a leading indicator, and after some practice it’s not too difficult to spot.
When traded properly, you can be consistently profitable with divergences. The best thing about divergences is that you’re usually buying near the bottom or selling near the top. This makes the risk on your trades are very small relative to your potential reward.
Cha-ching!
Price and momentum normally move hand in hand like Hansel and Gretel, Ryu and Ken, Batman and Robin, Jay Z and Beyonce, Serena and Venus Williams, salt and pepper…You get the point.

Read More
he advantage of using bullish divergences is that it’s usually clearly visible, while the downside is that it doesn’t provide a precise buy signal. The divergence occurs when the price of an asset is somehow not in tune with what it is supposed to. For instance – when gold is declining but silver and/or mining stocks start to move higher – we see a bullish divergence.
The most common divergences are between asset’s price and some indicator based on it. In this case, the divergence occurs when price forms a lower low and the indicator forms a higher low. It shows us that even though price reaches new lows, the fuel for the downtrend starts running low. Divergence can show up on virtually any indicator’s chart, but the rule is always the same: the indicator does not confirm the price move. The charts below contain examples of bullish divergences.
Read More
DO NOT FEAR! HELP IS HERE
I will show you today how to trade a divergence. Happy days!
There are many types of divergences, but today I would like to focus on a divergence which allows one to enter into a long position, using the MACD, price action and two exponential moving averages.
I am not going to get technical about this, so let's keep this in easy-to-use language.
I will keep referring to the chart below so that you can easily visualize what I am talking about. If the chart below is too small, then I suggest that you open the excellent Dukascopy charting package and plot the same chart as I have. There is an excellent manual for the charting package and you can access it here: http://www.dukascopy.com/wiki/
EUR/CAD 4hour (starting April 2014)
These are the tools which you will need:
1. MACD: Fast period: 12, slow period 26 and signal period 9 (closing price);
2. Exponential moving averages: EMA 20 blue (close) and EMA 105 pink (close);
Read More
 FactSet
‘Bearish divergence’ is warning investors not to buy the dip
A chart signal that warns you not to buy can be just as useful as one that warns you it’s time to sell. The long-term “bearish divergence” in the S&P 500’s chart suggests it is still much too soon to try to pick a bottom.
The bearish divergence was flashing a yellow light for stocks as far back as two years ago, but it didn’t turn red until a couple of weeks ago, when the S&P 500SPX, +0.41% broke below support at the January low.
Bearish divergences don’t necessarily suggest investors should sell, but they do warn that when a breakdown in price does occur, they should not fight it. The pattern now indicates the index could fall a lot further before the opposite “bullish divergence” appears
The Relative Strength Index (RSI) technical indicator, which compares the magnitude of recent gains with the magnitude of recent losses, is used by chart watchers to gauge the momentum of a market trend.
One way chart watchers use the RSI is to watch for when the RSI trend moves in the opposite direction of the price trend it tracks. When a bullish trend in price is accompanied by a bearish trend in the RSI—a “bearish divergence”--it implies the uptrend has lost momentum, and could reverse course at any time.
The bearish divergences depicted in the above chart are what the Market Technicians Association describes as the most-bearish type--“Class A bearish divergence”--as prices climbed to record highs while RSI hit distinct lower highs and lower lows.
Read More
When studying price charts, and looking for a potential change in trend, one useful feature to look for in the charts is that which is known as divergence. This refers to the divergence of the price when compared to a chart indicator — that is, when the price is heading in one direction, say up, while the indicator is heading in the other direction, say down.
Divergence comes in two variations — bullish divergence and bearish divergence, and each of these types of divergence can be classified as of three different “strengths” — Class A, Class B, or Class C.
Bullish divergence - Basically, this is where the price is making lower lows,
while the indicator is making higher lows. This is an indication of underlying strength building in the stock.
Bearish divergence - Basically, this is where the price is making higher highs,
while the indicator is making lower highs. This is an indication of underlying weakness building in the stock.
Divergence is a concept that can allow a trader to see a possible reversal in the direction of price ahead of time.
What is divergence? Divergence is used to spot a reversal in the direction of price ahead of time. It shows that conditions could be changing and allows a trader to look for possible entries in the opposite direction of the trend.
When you see a divergence, it is not a definite indication that the market will change, or that as soon as a divergence is seen, a trader should enter a counter-trend trade. It does, however, allow a trader to see that the current market conditions could be changing and they should start looking for possible entries in the opposite direction to the current trend. The higher the time frame the stronger the likelihood that a reversal may occur.
Generally, an indicator will move in conjunction with the price — if the price is making higher highs, then the indicator will also make higher highs, as observed by the chart below.

number_1 Higher highs on the price and higher highs on the indicator
However, a divergence takes place when the indicator moves out of sync with the price action over a period of time. The length of the time is unimportant, just enough to make the comparison.
Read More
Divergences are one of my favorite trading concepts because they offer very reliable high-quality trading signals. Although indicators are somewhat lagging – just like price action is lagging too – when it comes to divergences, this lagging feature is actually going to help us find better and more reliable trade entries as we will see below. Divergences can not only be used by reversal traders, but also trend-following traders can use divergences to time their exits. In my own trading strategy, divergences are a big part.
A divergence forms on your chart when price makes a higher high, but the indicator you are using makes a lower high. When your indicator and price action are out of sync it means that “something” is happening on your charts that requires your attention and it’s not as obvious by just looking at your price charts.
Basically, a divergence exists when your indicator does not “agree” with price action. Granted, this is very basic and we will not explore more advanced divergence concepts and see how to trade them, but it’s important to build a solid foundation.

Read More
However, there is a third kind of a divergence, which does not fall into the regular divergence group. This is the Hidden Divergence pattern.
One of the most important technical signals to watch for on any chart is a divergence. Simply stated, a divergence occurs when prices move in one direction (up or down) and an indicator based on those prices moves in the opposite direction.
Divergences signal impending changes in the direction of a stock's price. They come in two flavors - "positive" (AKA "bullish") and "negative" (AKA "bearish"). A positive divergence happens when an indicator starts moving higher after prices have been in a downtrend (a potentially bullish development). A negative divergence occurs when an indicator moves lower while prices are still rising and is a bearish warning signal.
Any oscillating indicator can be used in a divergence study. Popular choices include the MACD, Stochastics, and Wilder's RSI. Many people also use indicators that include volume information - Chaikin's Money Flow for example - since price and volume often diverge at key turning points.
Unfortunately, like many things in the field of technical analysis, spotting divergences while they are still forming can be tricky. The biggest problem is distinguishing between a real divergence and just random "noise" on the chart. Just because a stock moves up for two days while its RSI (for example) declines, it doesn't necessarily mean that a significant divergence has developed - yet.
Often, peak-and-trough analysis is used to find divergences. If, for example, two or more rising troughs appear on the price plot (an uptrend), while two or more decline peaks appear at the same time on the indicator graph (a downtrend), a bearish divergence has been identified. This is how divergence is often taught in textbooks.
As with all forms of peak-and-trough analysis, there are two key problems with this approach. The first problem is that clear trendlines take time to form. The underlying trading opportunity associated with the divergence may be over by the time an unambiguous picture appears on the chart. The second problem is that identifying significant peaks and troughs is often very subjective - one person's significant peak is another person's random spike. For these reasons, peak-and-trough divergence detection is hard to automate (i.e., you can't create scans for it) and it is best used for finding exit signals for existing positions.
Simple divergence scans can be created by selecting (somewhat arbitrarily) a time duration (5 days for
Read More
Divergence is a useful indicator, or method, to identify and trade trend reversal moves. Divergence occurs when price moves in one direction and the indicator starts moving in the opposite direction. There are three published versions of divergence known as Type-A, -B and –C. discussed by Dr Alexander Elder in his best seller, Trading for a Living. As the Type-A setup is the most powerful it's the only one that makes an appearance in our Playbook.
There are a number of indicators used to identify divergence including the MACD, RSI, Williams %R and Stochastic. The trick is to pick one indicator and stay with it and not be tempted to chop and change. Most indicators are used incorrectly and thus they tend to be futile when used in the real world. In my, Swing Trading video I outline divergence as the only setup that uses an indicator and the indicator of my choice is the Stochastic.
Let’s define the Stochastic:
The Stochastic (Slow) indicator calculates the location of a current price in relation to its range over a period of bars. The default settings are the most recent 14 bars, the high and low of that period to establish a range and the close as the current price. This calculation is then indexed, smoothed and plotted as SlowK. A smoothed average of SlowK, known as SlowD, is also plotted. SlowK and SlowD plot as oscillators with values from 0 to 100. The direction of the Stochastics should confirm price movement.
The following chart shows a Type-A Bearish Divergence on the daily chart of Medusa Mining (MML). Prices probe higher but the indicator fails to make a secondary higher high:
Read More
new to technical analysis and those who wish to re-visit some basics. It includes some useful tips for people wishing to trade / rather than just analyze.
Divergence is a by-product of the use of price charts and indicator(s). It is not always present to herald a change of trend / but when it does appear it is well worth heeding the early warning of possible price reversal. There appears to be a hierarchy of usefulness of indicators regarding divergence. Some are extremely powerful while others rarely (if ever) provide this added benefit.
When divergence is identified, it is the indicator that assumes “naming rights”. Consequently, if the price suggests a continued upward movement and the indicator suggests downward movement, the bearish (i.e. downward) nature of the indicator takes control – hence Bearish Divergence. Alternatively, if the price action suggests continuation of a downward movement and the indicator suggests upward (i.e. bullish) movement, this is a case of Bullish Divergence.
The convention for determining bearish divergence is to look at the peaks of both price and indicator. If the price peaks are getting higher and the indicator peaks are getting lower (bearish) then you have bearish divergence.
For bullish divergence it is a little different. Here it is the troughs of both price and indicator that are important. When the price troughs are getting lower and the indicator troughs are getting higher (bullish), the price action and the indicator are displaying bullish divergence.
Although it is seldom (if ever) mentioned in the text books and / or reputable published articles, accurate record keeping and communication of findings should nominate the indicator displaying divergence with price. For example “bullish divergence is being shown between XYZ and the slow stochastic indicator”.
Read More
Certainly we have covered the topic of Bullish Divergence well and there is enough about it in these articles to equip traders to use this tool for great trades.
Should you have any questions or additional informnation please be sure to fill in the comment forme below
Good Trading..!
It is usually located by noticing the movement of an oscillator such as Macd or CCI or Stochastic.
In this guide you will find many sources of information abouit Bullish Divergence and those ideas will assist your trading.
Studying a Bullish Divergence Trading Strategy will enhance your trading, particularly if you like to see what the end of a downtrend looks like.
Divergences, Momentum And Rate Of Change
Oscillators tend to be somewhat misunderstood in the trading industry, despite their close association with the all-important concept of momentum. At its most fundamental level, momentum is actually a means of assessing the relative levels of greed or fear in the market at a given point in time. Markets ebb and flow, surge and retreat - the speed of such movement is measured by oscillators.
Oscillators are most useful and issue their most valid trading signals when their readings diverge from prices. A bullish divergence occurs when prices fall to a new low while an oscillator fails to reach a new low. This situation demonstrates that bears are losing power, and that bulls are ready to control the market again - often a bullish divergence marks the end of a downtrend. Bearish divergences signify potential downtrends, when prices rally to a new high while the oscillator refuses to reach a new peak. In this situation, bulls are losing their grip on the market, prices are rising only as a result of inertia, and the bears are ready to take control again.
Types of DivergencesDivergences, whether bullish or bearish in nature, have been classified according to their levels of strength. The strongest divergences are Class A divergences; exhibiting less strength are Class B divergences; and the weakest divergences are Class C. The best trading opportunities are indicated by Class A divergences, while Class B and C divergences represent choppy market action and should generally be ignored.
Class A bearish divergences occur when prices rise to a new high but the oscillator can only muster a high that is lower than exhibited on a previous rally. Class A bearish divergences often signal a sharp and significant reversal toward a downtrend. Class A bullish divergences occur when prices reach a new low but an oscillator reaches a higher bottom than it reached during its previous decline. Class A bullish divergences are often the best signals of an impending sharp rally.
Class B bearish divergences are illustrated by prices making a double top, with an oscillator tracing a lower second top. Class B bullish divergences occur when prices trace a double bottom, with an oscillator tracing a higher second bottom.
Read more:
How to Trade Bullish and Bearish Technical Divergences
When an indicator “fights” with the actual price action traders can profit.
Sometimes a technical indicator will disagree or “fight” with the actual price action of the stock or index you are analyzing. These “disagreements” are actually very useful for technical traders. In this three part series we will discuss and learn how to apply these powerful technical signals called divergences
Trading divergences – Part One
A divergence appears when a technical indicator (usually an oscillator) begins to establish a trend that disagrees with the actual price movement. For example, in the chart below you can see the QQQQ forming lower lows from January through March of 2008.
This is representative of a market that is becoming more bearish. However, the RSI technical indicator I have applied is showing a series of higher lows, which is indicative of an improving trend.
For QQQQ shorts, this is a warning that risk control is going to become much more important because there is a high probability that the trend will be disrupted in the short term.
For more speculative traders looking to get long the QQQQ or buy calls, this “bullish divergence” is an alert that a change in the trend may be emerging. In the video I will cover another great example of a bullish divergence like the one on the QQQQ but on an individual stock.
Traders use technical indicators like oscillators because they filter a lot of the noise within the price action. Oscillators are typically designed to show a trader when prices have reached extremes and a reversal is likely. However, how extreme is too extreme?
The disagreement or divergence between bearish price action (lower lows) and the trend of the oscillator (higher lows) is one way to answer that question. When this happens it indicates that investor sentiment is too extreme and a reversal to the upside is likely.
Divergences can happen to trigger trades both directions.
Divergences can be an important warning signal that a bullish trend is ending. In the last article I talked about how to use bullish divergences to time an entry into a new long position or to look out for weakness in a downward trend but there are also bearish divergences that long traders need to watch for.
Besides describing a bearish divergence I will further refine divergence analysis, in this article, to help you understand what types of divergences matter most and what you should be looking for on a day to day basis.
Trading divergences – Part Two
Read MoreTrading Divergences
What if there was a low risk way to sell near the top or buy near the bottom of a trend?What if you were already in a long position and you could know ahead of time the perfect place to exit instead of watching your unrealized gains, a.k.a your potential Aston Martin down payment, vanish before your eyes because your trade reverses direction?
What if you believe a currency pair will continue to fall but would like to short at a better price or a less risky entry?
Well guess what? There is a way! It’s called divergence trading.
In a nutshell, divergence can be seen by comparing price action and the movement of an indicator. It doesn’t really matter what indicator you use. You can use RSI, MACD, the stochastic, CCI, etc.
The great thing about divergences is that you can use them as a leading indicator, and after some practice it’s not too difficult to spot.
When traded properly, you can be consistently profitable with divergences. The best thing about divergences is that you’re usually buying near the bottom or selling near the top. This makes the risk on your trades are very small relative to your potential reward.
Cha-ching!
Trading Divergences
Just think “higher highs” and “lower lows”.Price and momentum normally move hand in hand like Hansel and Gretel, Ryu and Ken, Batman and Robin, Jay Z and Beyonce, Serena and Venus Williams, salt and pepper…You get the point.
Read More
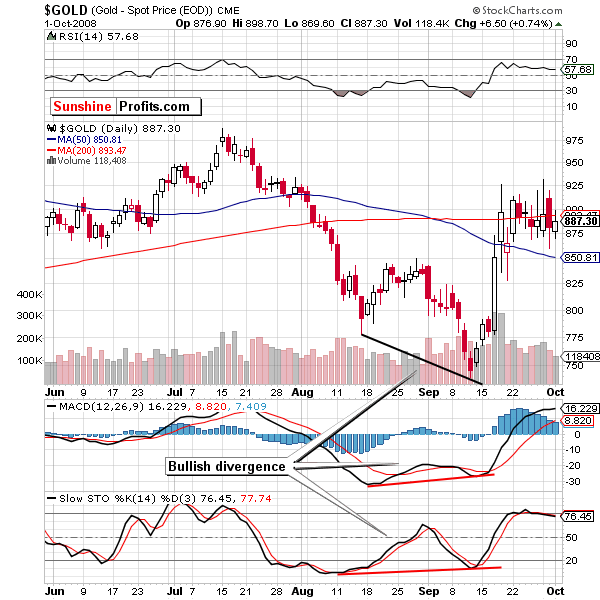
BULLISH DIVERGENCE
A bullish divergence between the price and a technical indicator is a moderately useful tool for detecting a coming reversal in the bearish trend.he advantage of using bullish divergences is that it’s usually clearly visible, while the downside is that it doesn’t provide a precise buy signal. The divergence occurs when the price of an asset is somehow not in tune with what it is supposed to. For instance – when gold is declining but silver and/or mining stocks start to move higher – we see a bullish divergence.
The most common divergences are between asset’s price and some indicator based on it. In this case, the divergence occurs when price forms a lower low and the indicator forms a higher low. It shows us that even though price reaches new lows, the fuel for the downtrend starts running low. Divergence can show up on virtually any indicator’s chart, but the rule is always the same: the indicator does not confirm the price move. The charts below contain examples of bullish divergences.
Bullish Divergence in Gold
The chart below shows an example of bullish divergence on the gold market. It also illustrates one crucial idea when it comes to divergences: they do not necessarily show up on every indicator’s chart. Read More
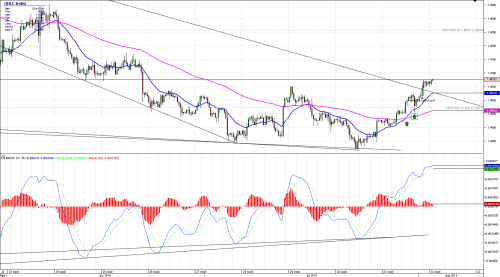
How to Trade a Bullish Divergence
Did you know that a trend will last much longer than what you think and just when you think it is time to go with the trend that you will most probably be wrong?DO NOT FEAR! HELP IS HERE
I will show you today how to trade a divergence. Happy days!
There are many types of divergences, but today I would like to focus on a divergence which allows one to enter into a long position, using the MACD, price action and two exponential moving averages.
I am not going to get technical about this, so let's keep this in easy-to-use language.
I will keep referring to the chart below so that you can easily visualize what I am talking about. If the chart below is too small, then I suggest that you open the excellent Dukascopy charting package and plot the same chart as I have. There is an excellent manual for the charting package and you can access it here: http://www.dukascopy.com/wiki/
EUR/CAD 4hour (starting April 2014)
These are the tools which you will need:
1. MACD: Fast period: 12, slow period 26 and signal period 9 (closing price);
2. Exponential moving averages: EMA 20 blue (close) and EMA 105 pink (close);
Read More
‘Bearish divergence’ is warning investors not to buy the dip in the stock market
FactSet ‘Bearish divergence’ is warning investors not to buy the dip
A chart signal that warns you not to buy can be just as useful as one that warns you it’s time to sell. The long-term “bearish divergence” in the S&P 500’s chart suggests it is still much too soon to try to pick a bottom.
The bearish divergence was flashing a yellow light for stocks as far back as two years ago, but it didn’t turn red until a couple of weeks ago, when the S&P 500SPX, +0.41% broke below support at the January low.
Bearish divergences don’t necessarily suggest investors should sell, but they do warn that when a breakdown in price does occur, they should not fight it. The pattern now indicates the index could fall a lot further before the opposite “bullish divergence” appears
The Relative Strength Index (RSI) technical indicator, which compares the magnitude of recent gains with the magnitude of recent losses, is used by chart watchers to gauge the momentum of a market trend.
One way chart watchers use the RSI is to watch for when the RSI trend moves in the opposite direction of the price trend it tracks. When a bullish trend in price is accompanied by a bearish trend in the RSI—a “bearish divergence”--it implies the uptrend has lost momentum, and could reverse course at any time.
The bearish divergences depicted in the above chart are what the Market Technicians Association describes as the most-bearish type--“Class A bearish divergence”--as prices climbed to record highs while RSI hit distinct lower highs and lower lows.
Read More
Divergence and Bearish Divergence
When studying price charts, and looking for a potential change in trend, one useful feature to look for in the charts is that which is known as divergence. This refers to the divergence of the price when compared to a chart indicator — that is, when the price is heading in one direction, say up, while the indicator is heading in the other direction, say down.
Divergence comes in two variations — bullish divergence and bearish divergence, and each of these types of divergence can be classified as of three different “strengths” — Class A, Class B, or Class C.
Sample 1 - All Ordinaries index (late 2007)
Take a look at the sample chart in the page header above (click on the image for a larger version). This weekly line chart of the All Ordinaries index (XAO) is now a few years old, but it clearly demonstrates the idea, and there are plenty more samples of divergence in more recent charts. Note the following features in this sample chart:- As the index rises and falls, the Momentum indicator usually rises and falls roughly in sync - most of the time. Except for the period flagged as “A” in this chart.
- During the period indicated as “A”, the index kept running higher through April, May, June and July 2007 to make a Higher High in October, while the indicator failed to make Higher Highs and in fact made Lower Highs down into October.
- This is "Class A" bearish divergence, and warned of underlying weakness in the Australian index. We know that the index then went on to fall more than 50 percent in the following several months. Chartists would not have been surprised, due to this chart known as bearish divergence. See a chart of this fall in the Bear Markets section of the Toolbox.
Divergence - bullish and bearish
The notion of divergence is basically where the price of the index or stock continues to trend in one direction while a chart indicator trends in the other direction.Bullish divergence - Basically, this is where the price is making lower lows,
while the indicator is making higher lows. This is an indication of underlying strength building in the stock.
Bearish divergence - Basically, this is where the price is making higher highs,
while the indicator is making lower highs. This is an indication of underlying weakness building in the stock.
Sample 2 - All Ordinaries index (2009)
Read MoreDivergence
Divergence is a concept that can allow a trader to see a possible reversal in the direction of price ahead of time.
What is divergence? Divergence is used to spot a reversal in the direction of price ahead of time. It shows that conditions could be changing and allows a trader to look for possible entries in the opposite direction of the trend.
When you see a divergence, it is not a definite indication that the market will change, or that as soon as a divergence is seen, a trader should enter a counter-trend trade. It does, however, allow a trader to see that the current market conditions could be changing and they should start looking for possible entries in the opposite direction to the current trend. The higher the time frame the stronger the likelihood that a reversal may occur.
What is divergence and how to spot it
Usually when using indicators, you would look for specific signals — for example, when the stochastic indicator crosses the 20 or 80 line, or for the MACD lines to cross over.Generally, an indicator will move in conjunction with the price — if the price is making higher highs, then the indicator will also make higher highs, as observed by the chart below.
number_1 Higher highs on the price and higher highs on the indicator
However, a divergence takes place when the indicator moves out of sync with the price action over a period of time. The length of the time is unimportant, just enough to make the comparison.
Read More
How To Trade A Divergence – A Step By Step Trading Guide
Divergences are one of my favorite trading concepts because they offer very reliable high-quality trading signals. Although indicators are somewhat lagging – just like price action is lagging too – when it comes to divergences, this lagging feature is actually going to help us find better and more reliable trade entries as we will see below. Divergences can not only be used by reversal traders, but also trend-following traders can use divergences to time their exits. In my own trading strategy, divergences are a big part.
What is a divergence?
Let’s start with the most obvious question and explore what a divergence really is and what it tells you about price. You’d be surprised how many people get this wrong already.A divergence forms on your chart when price makes a higher high, but the indicator you are using makes a lower high. When your indicator and price action are out of sync it means that “something” is happening on your charts that requires your attention and it’s not as obvious by just looking at your price charts.
Basically, a divergence exists when your indicator does not “agree” with price action. Granted, this is very basic and we will not explore more advanced divergence concepts and see how to trade them, but it’s important to build a solid foundation.

Read More
How to Spot and Trade Bullish and Bearish Divergence Patterns
When trading forex, many traders use different indicators in order to get additional confirmation for their signals. The primary indicator that a trader should use is Price itself, because Price action will provide you the clearest picture and get your closest to what’s happening in the market at any given time. Having said that, there are times when you should combine price action analysis with traditional technical indicators. Typically, you would look for clues between the indicator and price action in order to make a decision. One of the most powerful trading signals that combines price action analysis with the use of indicators is the Divergence signal, and that’s what we intend to discuss in this lesson.Divergence Trading Patterns
The name of this pattern speaks of its character. We have a divergence when the price movement is contrary to the indicator movement. This type ofRegular Divergence pattern comes in two forms:Bearish Divergence
This is when price creates higher tops on the chart, while your indicator is giving you lower tops. After a bearish divergence, price usually makes a rapid bearish move. Notice that this happens despite the previous bullish attitude in the price.Bullish Divergence
The bullish divergence has absolutely the same characteristics as the bearish divergence, but in the opposite direction. We have a bullish divergence when the price makes lower bottoms on the chart, while your indicator is giving you higher bottoms. After a bullish divergence pattern, we are likely to see a rapid price increase.However, there is a third kind of a divergence, which does not fall into the regular divergence group. This is the Hidden Divergence pattern.
Hidden Bullish Divergence
Read MoreSCANNING FOR DIVERGENCES
Scanning for Emerging DivergencesOne of the most important technical signals to watch for on any chart is a divergence. Simply stated, a divergence occurs when prices move in one direction (up or down) and an indicator based on those prices moves in the opposite direction.
Divergences signal impending changes in the direction of a stock's price. They come in two flavors - "positive" (AKA "bullish") and "negative" (AKA "bearish"). A positive divergence happens when an indicator starts moving higher after prices have been in a downtrend (a potentially bullish development). A negative divergence occurs when an indicator moves lower while prices are still rising and is a bearish warning signal.
Any oscillating indicator can be used in a divergence study. Popular choices include the MACD, Stochastics, and Wilder's RSI. Many people also use indicators that include volume information - Chaikin's Money Flow for example - since price and volume often diverge at key turning points.
Unfortunately, like many things in the field of technical analysis, spotting divergences while they are still forming can be tricky. The biggest problem is distinguishing between a real divergence and just random "noise" on the chart. Just because a stock moves up for two days while its RSI (for example) declines, it doesn't necessarily mean that a significant divergence has developed - yet.
Often, peak-and-trough analysis is used to find divergences. If, for example, two or more rising troughs appear on the price plot (an uptrend), while two or more decline peaks appear at the same time on the indicator graph (a downtrend), a bearish divergence has been identified. This is how divergence is often taught in textbooks.
As with all forms of peak-and-trough analysis, there are two key problems with this approach. The first problem is that clear trendlines take time to form. The underlying trading opportunity associated with the divergence may be over by the time an unambiguous picture appears on the chart. The second problem is that identifying significant peaks and troughs is often very subjective - one person's significant peak is another person's random spike. For these reasons, peak-and-trough divergence detection is hard to automate (i.e., you can't create scans for it) and it is best used for finding exit signals for existing positions.
Simple divergence scans can be created by selecting (somewhat arbitrarily) a time duration (5 days for
Read More
TRADING WITH DIVERGENCE
The world of technical analysis is saturated with indicators, oscillators, lines and other weird and wonderful esoteric attempts at finding the Holy Grail. However there are really only three absolutes; price, volume and time. These items, coupled with patience and a level head for creating positive expectancy, enable us to be successful trading the market.Divergence is a useful indicator, or method, to identify and trade trend reversal moves. Divergence occurs when price moves in one direction and the indicator starts moving in the opposite direction. There are three published versions of divergence known as Type-A, -B and –C. discussed by Dr Alexander Elder in his best seller, Trading for a Living. As the Type-A setup is the most powerful it's the only one that makes an appearance in our Playbook.
There are a number of indicators used to identify divergence including the MACD, RSI, Williams %R and Stochastic. The trick is to pick one indicator and stay with it and not be tempted to chop and change. Most indicators are used incorrectly and thus they tend to be futile when used in the real world. In my, Swing Trading video I outline divergence as the only setup that uses an indicator and the indicator of my choice is the Stochastic.
Let’s define the Stochastic:
The Stochastic (Slow) indicator calculates the location of a current price in relation to its range over a period of bars. The default settings are the most recent 14 bars, the high and low of that period to establish a range and the close as the current price. This calculation is then indexed, smoothed and plotted as SlowK. A smoothed average of SlowK, known as SlowD, is also plotted. SlowK and SlowD plot as oscillators with values from 0 to 100. The direction of the Stochastics should confirm price movement.
The following chart shows a Type-A Bearish Divergence on the daily chart of Medusa Mining (MML). Prices probe higher but the indicator fails to make a secondary higher high:
Read More
Divergence – A Powerful Tool for Traders
This article attempts to describe and clarify how to recognize and use both Bullish Divergence and Bearish Divergence. It is aimed at people who arenew to technical analysis and those who wish to re-visit some basics. It includes some useful tips for people wishing to trade / rather than just analyze.
Divergence is a by-product of the use of price charts and indicator(s). It is not always present to herald a change of trend / but when it does appear it is well worth heeding the early warning of possible price reversal. There appears to be a hierarchy of usefulness of indicators regarding divergence. Some are extremely powerful while others rarely (if ever) provide this added benefit.
What is Divergence?
Divergence is the word used to describe the condition where the price and an indicator give opposite views. It is when the interpretation of price action suggests continuation of the current direction at the same time as the interpretation of an indicator [or other confirmation tool] suggests a reversal.When divergence is identified, it is the indicator that assumes “naming rights”. Consequently, if the price suggests a continued upward movement and the indicator suggests downward movement, the bearish (i.e. downward) nature of the indicator takes control – hence Bearish Divergence. Alternatively, if the price action suggests continuation of a downward movement and the indicator suggests upward (i.e. bullish) movement, this is a case of Bullish Divergence.
The convention for determining bearish divergence is to look at the peaks of both price and indicator. If the price peaks are getting higher and the indicator peaks are getting lower (bearish) then you have bearish divergence.
For bullish divergence it is a little different. Here it is the troughs of both price and indicator that are important. When the price troughs are getting lower and the indicator troughs are getting higher (bullish), the price action and the indicator are displaying bullish divergence.
Although it is seldom (if ever) mentioned in the text books and / or reputable published articles, accurate record keeping and communication of findings should nominate the indicator displaying divergence with price. For example “bullish divergence is being shown between XYZ and the slow stochastic indicator”.
Bullish Divergence

Certainly we have covered the topic of Bullish Divergence well and there is enough about it in these articles to equip traders to use this tool for great trades.
Should you have any questions or additional informnation please be sure to fill in the comment forme below
Good Trading..!
No comments:
Post a Comment