Of course, we all want to have the perfect trade entries and I may want that more than anyone else… After many years of searching, I still do not have the Holy Grail defined.
One thing that I seem to have determined is that time frames of less than 60 minutes do not suit me. Too many entries and too much screen time for the lower time frames.
I have drifted to the 4 hour and daily charts both for manual trading and automated. I well realize that many folks prefer the faster timeframes and have developed methods to become quite profitable on those.
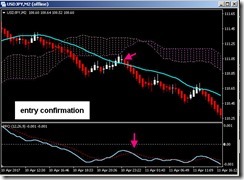
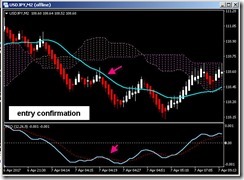
Today I will discuss a tool that I have been using as a confirmation for entries, the Percentage Price Oscillator. As ‘another indicator on the chart’, yes, it does cause more deliberation before an entry, another possible cause of confusion, and perhaps more ‘anaylsis paralysis’.
History
Gerald Appel developed the Macd indicator and the Percentage Price Oscillator is a derivative of his work. There is a significant difference between these two, although they use similar components.
The PPO is a derivative of the Macd
Calculation method
The MACD is calculated by subtracting the 26-day exponential moving average (EMA) from the 12-day EMA. A nine-day EMA of the MACD, called the "signal line", is then plotted on top of the MACD, functioning as a trigger for buy and sell signals.
To calculate the PPO, subtract the 26-day exponential moving average (EMA) from the nine-day EMA, and then divide this difference by the 26-day EMA.
As you can see there is a significant difference in the calculations. (Source: Investopedia)
Both are to be regarded as Momentum Indicators.


The difference between the two is reflected in that the PPO calculation is a percentage
The PPO is a little slower to indicate a confirmation than is the Macd, it’s cross is later, the move is further advanced when the PPO crosses. To a conservative trader, this is a plus.
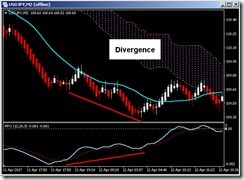
Both Macd and PPO are useful in detecting Price/Indicator Divergences.

Summary
Both Macd and PPO use moving averages to make their plots and as a result, both are lagging indicators. The 26 bar component is certainly behind the current price action and can cause missed opportunities.
Both of these indicators may be used to detect divergences……. and both may be used to locate entry points using their crosses.
Neither is to be used as the sole determinant for trade entries, more technical data and the fundamental information is required.

No comments:
Post a Comment